中国A股上市公司漂绿程度ESG信息披露华证ESG实际表现面板数据2009-2024年
一、数据背景
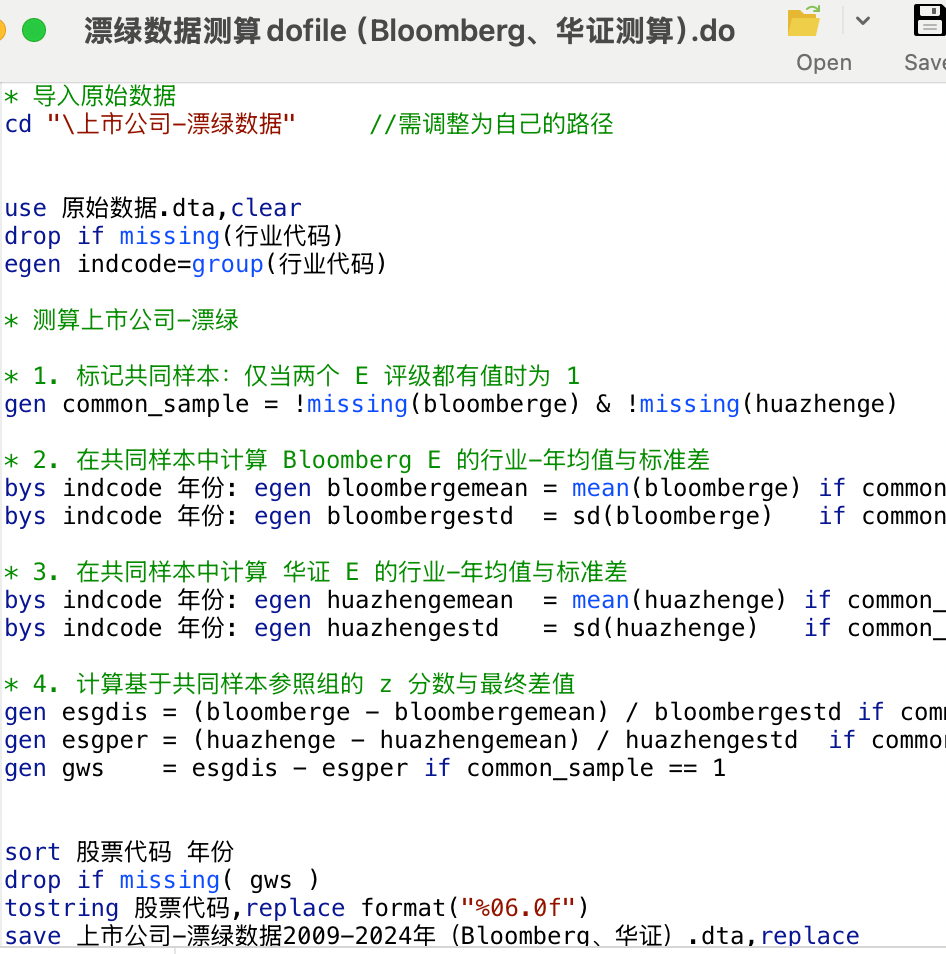
企业在ESG信息披露与实际ESG表现之间可能存在偏离,当披露较为充分积极而实际表现未同步改善时,即表现为较高程度的“漂绿”。借鉴Yu et al.(2020)、Zhang(2022)的做法,以Bloomberg ESG披露评分衡量披露水平、以华证ESG的E得分衡量实际表现,分别在同行业内标准化后作差构建漂绿指标,并参照Hu et al.(2023)采用E得分对中国上市公司漂绿程度进行测算,可用于ESG、绿色金融与公司治理相关实证研究。
二、数据介绍
时间范围:2009-2024年
覆盖范围:中国A股上市公司(含省份、城市、区县地理维度字段)
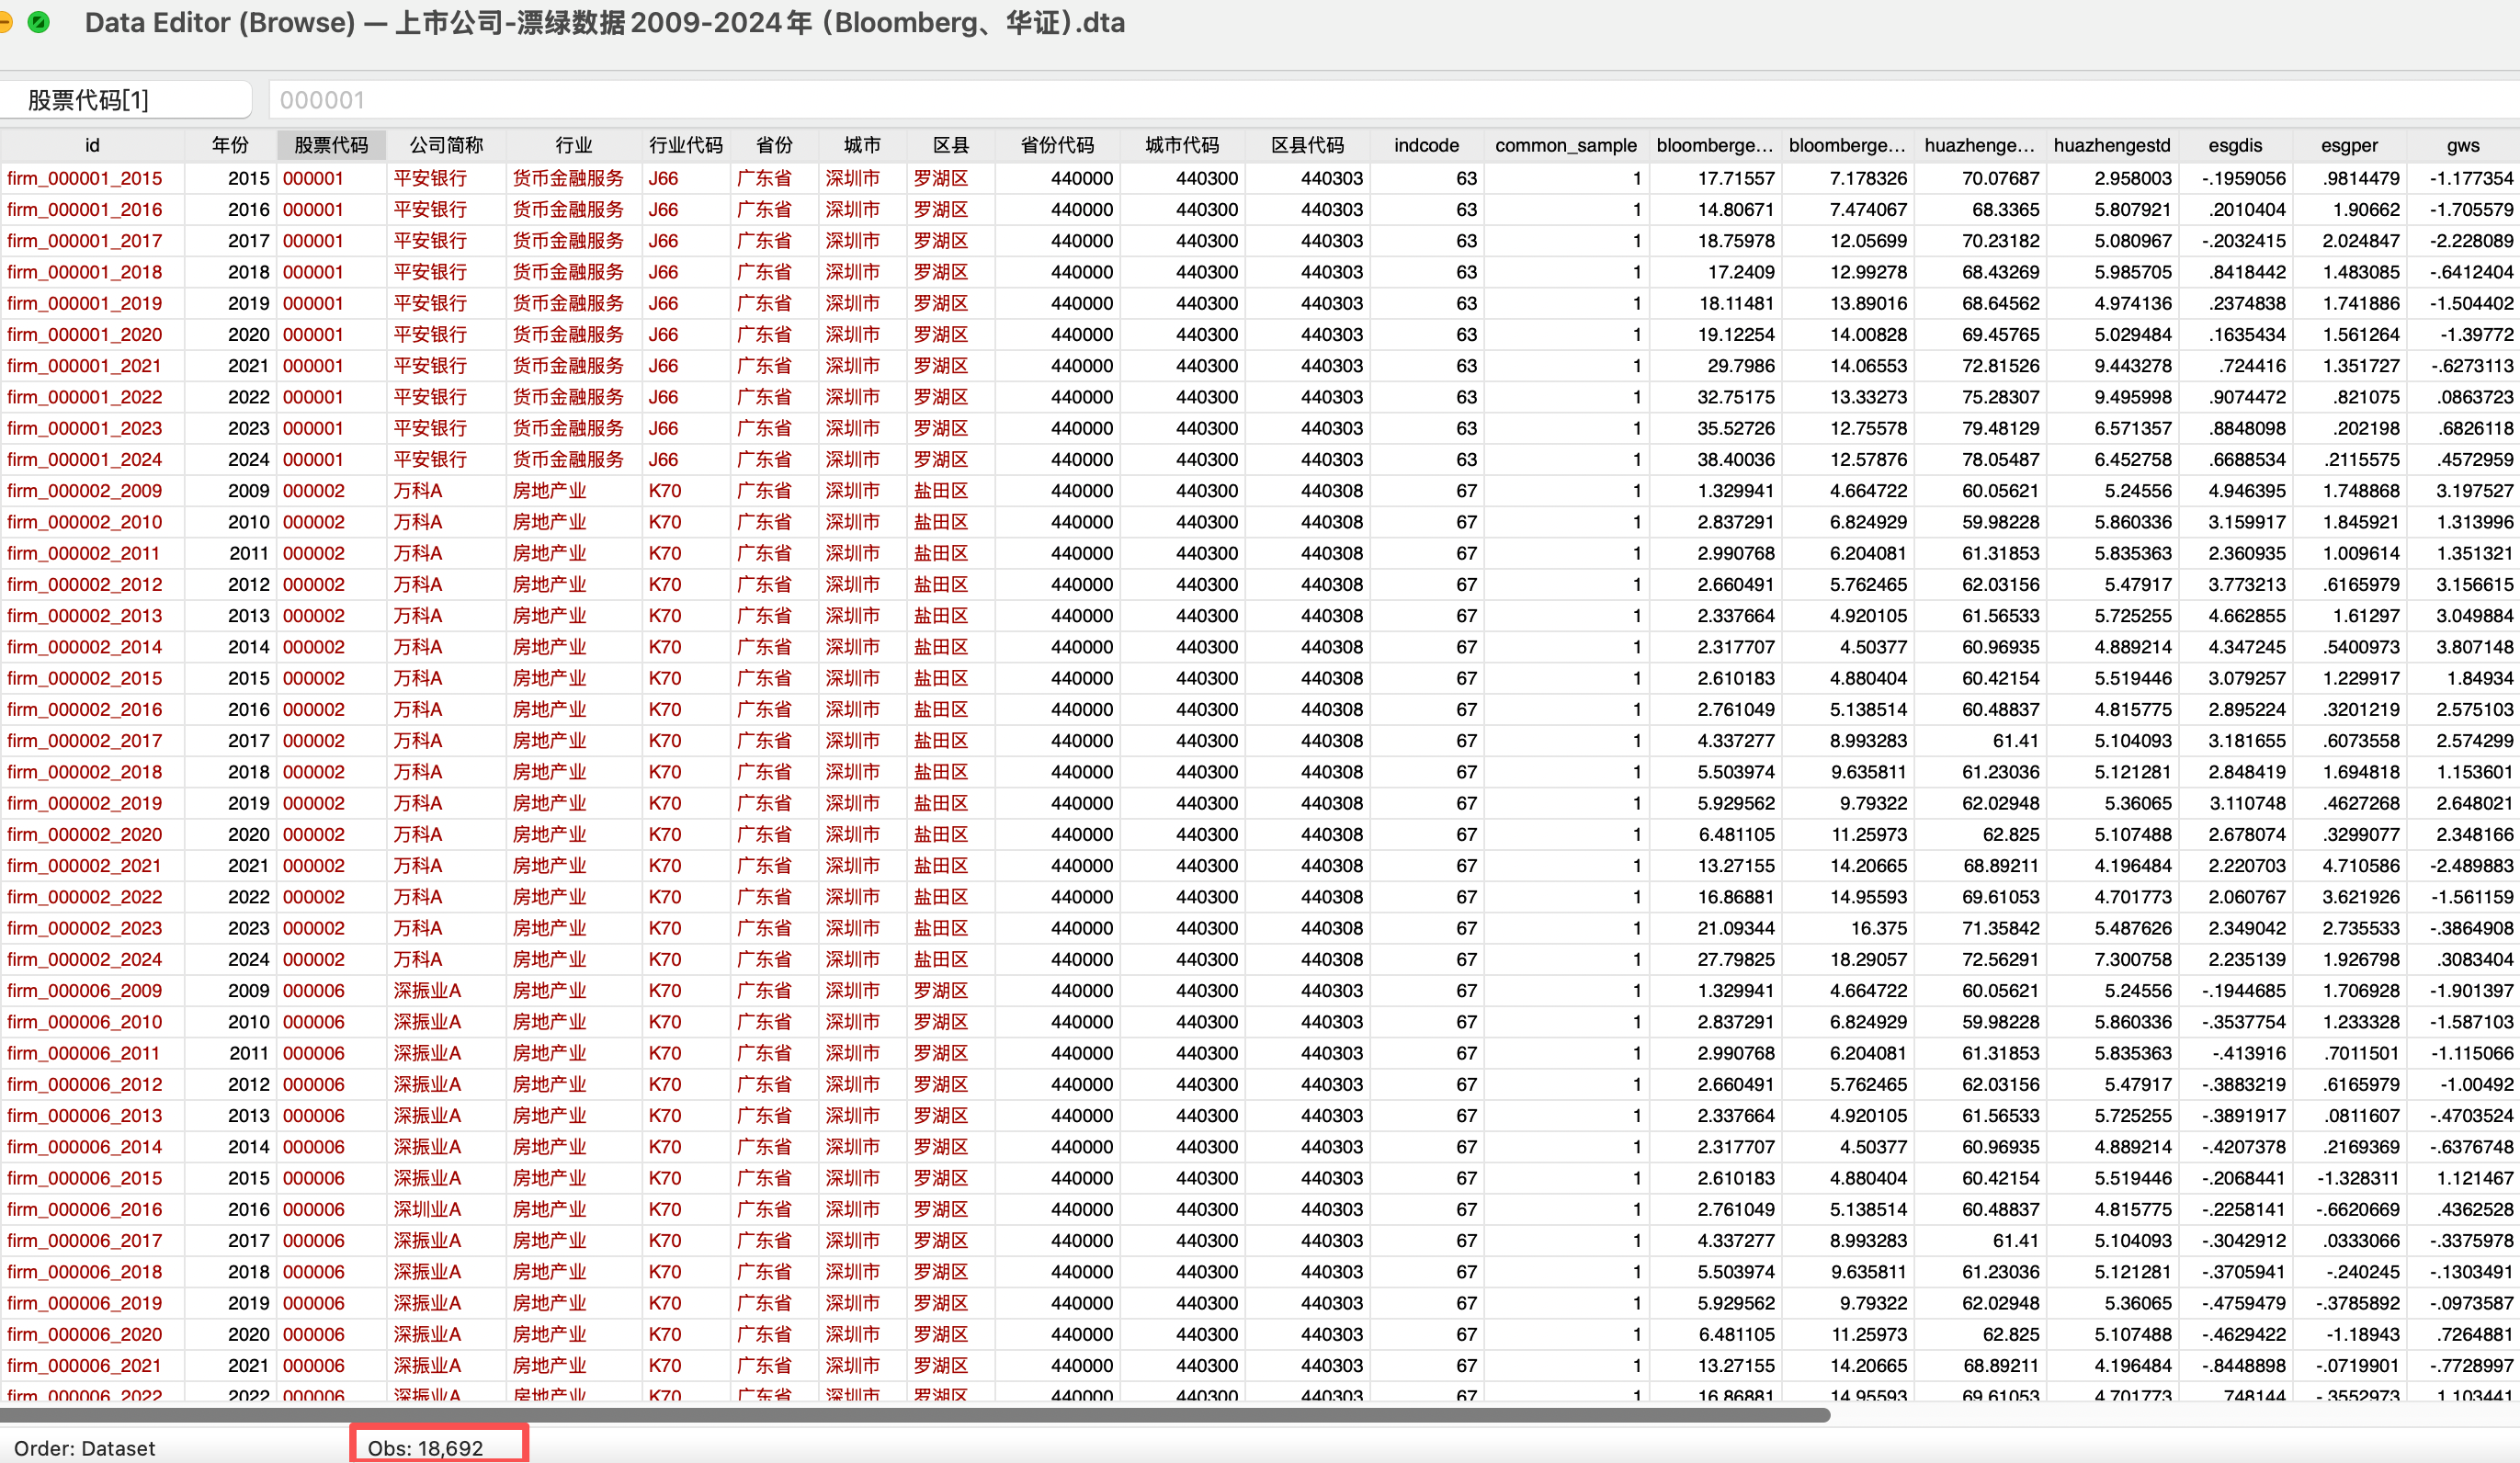
样本数量:18,692条公司-年份观测值
数据来源:Bloomberg ESG(披露评分)、华证ESG(E得分)
数据说明:围绕上市公司“漂绿”程度测度整理相关指标,以标准化披露水平与标准化实际表现的差值刻画漂绿倾向,数值越大漂绿倾向越强,可用于ESG披露与绿色金融相关实证研究。Stata格式Stata格式+do文件,含参考文献、测算说明
三、数据指标
| 序号 | 指标名称 | 说明 |
| 1 | id | — |
| 2 | 年份 | — |
| 3 | 股票代码 | — |
| 4 | 公司简称 | — |
| 5 | 行业 | — |
| 6 | 行业代码 | — |
| 7 | 省份 | — |
| 8 | 城市 | — |
| 9 | 区县 | — |
| 10 | 省份代码 | — |
| 11 | 城市代码 | — |
| 12 | 区县代码 | — |
| 13 | indcode | — |
| 14 | common_sample | — |
| 15 | bloombergemean | Bloomberg E得分行业均值 |
| 16 | bloombergestd | Bloomberg E得分行业标准差 |
| 17 | huazhengemean | 华证E得分行业均值 |
| 18 | huazhengestd | 华证E得分行业标准差 |
| 19 | esgdis | ESG披露水平 |
| 20 | esgper | ESG实际表现 |
| 21 | gws | 漂绿程度指标 |
四、参考文献
[1]YU E P Y, VAN LUU B, CHEN C H. Greenwashing in environmental, social and governance disclosures[J]. Research in International Business and Finance, 2020, 52: 101192.
[2]ZHANG D. Green financial system regulation shock and greenwashing behaviors: Evidence from Chinese firms[J]. Energy Economics, 2022, 111: 106064.
[3]HU X, HUA R, LIU Q, WANG C. The green fog: Environmental rating disagreement and corporate greenwashing[J]. Pacific-Basin Finance Journal, 2023, 78: 101952.
五、数据概览
数据行数:18,692条(以数据文件为准)
指标数量:21项






 扫码加好友,拉您进群
 全部版块
 我的主页


 收藏