宇宇positive 发表于 2018-4-10 23:43 
首先,把各列名称改为英文序号(不要用中文,用14也做不出来),然后从excel将矩阵导入stata面板当中,对计 ...
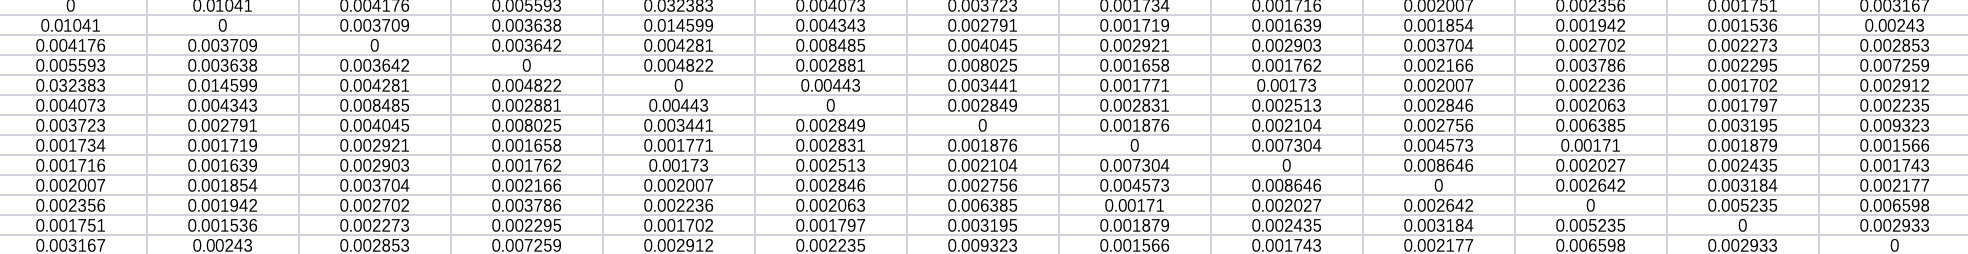
您好!我的散点图解决了,但是咋进行面板数据检验的时候出现问题了,它显示
*: 3200 conformability error
_xsmle_est(): - function returned error
<istmt>: - function returned error
r(3200);
3200说我的矩阵数和我的面板的省份数量不一致,即
A matrix, vector, or scalar has the wrong number of rows and/or
columns for what is required.
Adding a 2 x 3 matrix to a 1 x 4
would result in this error.
但是我的面板数据也是31个省份,只不过年份是13年的,变量只使用了两个进行试验,但是还是有错误。版主你知道这个怎么解决么?


 扫码加好友,拉您进群
 全部版块
全部版块 我的主页
我的主页