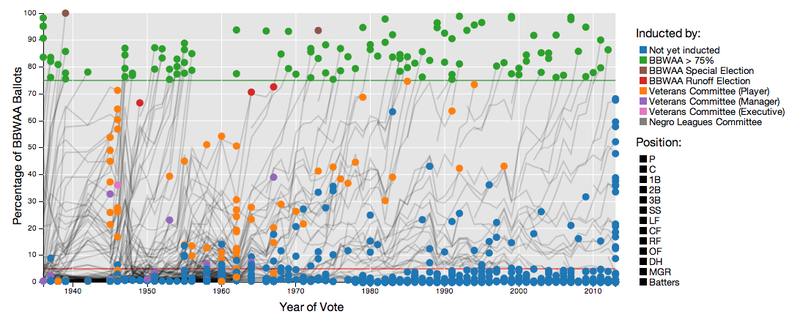
The main figure above is a plot of BBWAA Hall of Fame voting by year for all 1,070 players who have appeared on the ballot since Hall of Fame voting began in 1936. The circular points represent each player's vote percentage in his final year on the BBWAA ballot, and the lines represent his vote percentage in prior years if he appeared on the ballot multiple times.
R was used to develop the original version of the visualization above, but if you click it you can see the D3-based interactive version which allows you highlight individual platers, filter by position and see various stats of the players. In addition to the interactive chart, you can find more information about the data behind this visualization and how it was created at the link below.
cscheid.net: MLB Hall of Fame Voting Trajectories


 扫码加好友,拉您进群
 全部版块
全部版块 我的主页
我的主页

 收藏
收藏