Proc Gplot:运用Gplot作图
原文地址:http://www2.sas.com/proceedings/sugi31/239-31.pdf
转载出处:http://blog.sina.com.cn/s/blog_5d3b177c0100b68a.html
Data如下,为一个时间序列数据。这个数据是自己编的,只是为了方便测试程序。
data t112;
input nh_tot fg_tot year;
cards;
90 90 1970
120 100 1971
170 110 1972
240 120 1973
330 130 1974
440 140 1975
560 150 1976
690 160 1977
850 170 1978
1090 180 1979
1290 190 1980
1590 200 1981
;
run;
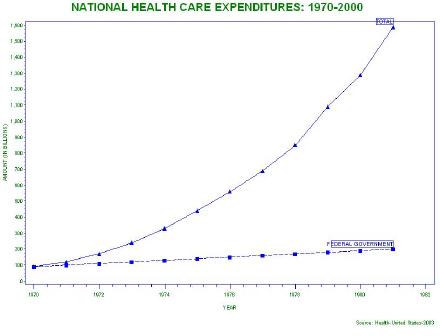
11 对曲线进行标注:
data my_labels;
retain xsys ysys '2' function 'label'
position '1' style "'Arial/bo'"
color 'blue' cborder 'blue';
set t112 end=last;
if last then do;
text=' FEDERAL GOVERNMENT '; x=year; y=fg_tot; output;
text=' TOTAL ' ; x=year; y=nh_tot; output;
end;
run;
goptions ftext='Arial' htext=2 gunit=pct ctext=green csymbol=blue;
options validvarname=upcase;
symbol1 f=marker v='C' i=join h=1.25;
symbol2 f=marker v='U' i=join h=1.25;
axis1 label=(angle=90 rotate=0 "AMOUNT (IN BILLIONS)") minor=(n=3);
axis2 order=(1970 to 1982 by 2) minor=(n=4) offset=(2,2);
title h=4 f='Arial/bo' "NATIONAL HEALTH CARE EXPENDITURES: 1970-1982";
footnote j=right "Source: Health-United States-2003";
proc gplot data=t112;
plot (nh_tot fg_tot)*year/overlay vaxis=axis1 haxis=axis2 caxis=blue annotate=my_labels;
format nh_tot comma.;
run;
 Gplot:运用Gplot作图" title="Proc Gplot:运用Gplot作图" action-data="http%3A%2F%2Fs12.sinaimg.cn%2Fbmiddle%2F5d3b177cg5bd8ff5d666b" action-type="show-slide" style="border-; border-style: initial; list-style: none;">
12 生成一个GIF图像文件
options validvarname=upcase;
goptions device=gif gsfname=gout xpixels=1024 ypixels=768
ftext='Arial' htext=2 gunit=pct ctext=green csymbol=blue;
symbol1 f=marker v='C' i=join h=1.25;
symbol2 f=marker v='U' i=join h=1.25;
axis1 label=(angle=90 rotate=0 "AMOUNT (IN BILLIONS)") minor=(n=3);
axis2 order=(1970 to 1982 by 2) minor=(n=4) offset=(2,2);
legend1 label=none value=(j=left "TOTAL" j=left "FEDERAL GOVT")
mode=protect position=(top inside left)
cborder=blue cshadow=blue
across=1 shape=symbol(6,1.25);
title h=4 f='Arial/bo' "NATIONAL HEALTH CARE EXPENDITURES: 1970-2000";
footnote j=right "Source: Health-United States-2003";
filename gout 'c:\healthexp.gif';
proc gplot data=t112;
plot (nh_tot fg_tot)*year/overlay vaxis=axis1 haxis=axis2 caxis=blue legend=legend1;
format exp comma.;
run;
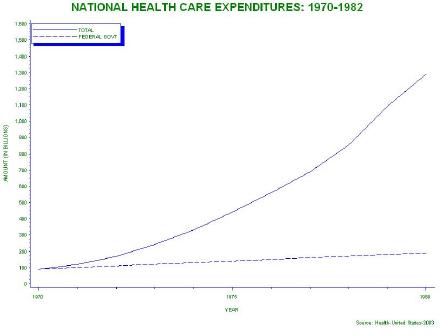
13 noframe选项,使得图像能自动调整适合的大小
options validvarname=upcase;
goptions ftext='Arial' htext=2 gunit=pct ctext=green csymbol=blue;
symbol1 v=dot i=join h=2.5 l=1;
symbol2 v=dot i=join h=2.5 l=3;
axis1 label=(angle=90 rotate=0 "AMOUNT (IN BILLIONS)") minor=(n=3);
axis2 order=(1970 to 1982 by 5) minor=(n=4) offset=(2,2);
legend1 label=none value=(j=left "TOTAL" j=left "FEDERAL GOVT")
mode=protect position=(top inside left)
cborder=blue cshadow=blue
across=1 shape=line(10);
title h=4 f='Arial/bo' "NATIONAL HEALTH CARE EXPENDITURES: 1970-1982";
footnote j=right "Source: Health-United States-2003";
proc gplot data=t112;
plot (nh_tot fg_tot)*year/overlay vaxis=axis1 haxis=axis2 caxis=blue legend=legend1 noframe;
format nh_tot comma.;
run;
 Gplot:运用Gplot作图" title="Proc Gplot:运用Gplot作图" action-data="http%3A%2F%2Fs12.sinaimg.cn%2Fbmiddle%2F5d3b177cg5bd900b83ddb" action-type="show-slide" style="border-; border-style: initial; list-style: none;">


 扫码加好友,拉您进群
 全部版块
全部版块 我的主页
我的主页

 收藏
收藏


