Reproducible ExampleI begin by creating model objects for two Ordinary Least Squares (OLS) models (using the lm() command) and a probit model (using glm() ). Note that I use data from attitude, one of the standard data frames that should be provided with your installation of R.
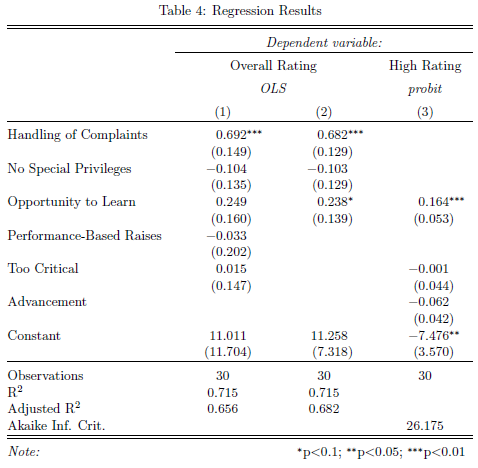
I then use stargazer to create a ‘traditional’ LaTeX table with standard errors. With the sole exception of the argument no.space– which I use to save space by removing all empty lines in the table – both the command call and the resulting table should look familiar from earlier versions of the package:
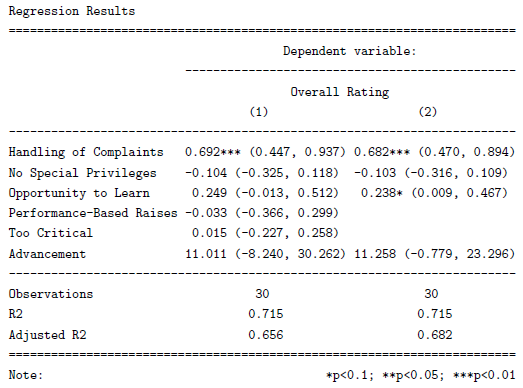
In the next table, I limit myself to the two linear models, and report 90 percent confidence intervals (using the ci and ci.levelarguments). In addition, I use the argument single.row to report the coefficients and confidence intervals on the same row.

To produce ASCII text output, rather than LaTeX code, I can simply set the argument type to “text”:
What Else is New?The two new features that I have focused on in this blog post, of course, do not exhaust the range of innovations that the new stargazer brings. The package can now output beautiful LaTeX and ASCII text tables directly into .tex and.txt files, respectively, using the out argument.
Additionally, users have a greater scope for making changes to the table’s formatting. A much-demanded addition to version 4.0 concerns column labels. Using arguments column.labels and column.separate, users can now add a label to each of the columns in their regression table. Such labels can be used to indicate, among other things, the sub-sample or research hypothesis that a particular column refers to. In addition, users can also change the caption above the names of the dependent variables (argument dep.var.caption), as well as tinker with the font size in the resulting table (argument font.size).
More advanced users can now choose whether the LaTeX table should be enclosed within a floating environment (arguments floatand float.env), and where the resulting table should be placed within the LaTeX document (argument table.placement). In this way, they might, for example, create a LaTeX table that is rotated by 90 degrees (when float.env = “sidewaystable”).
Marek Hlavac is a doctoral student in the Political Economy and Government program at Harvard Unviersity. If you have any suggestions for future versions of the stargazer package, please contact him at hlavac@fas.harvard.edu .


 扫码加好友,拉您进群
 全部版块
全部版块 我的主页
我的主页

 收藏
收藏


