By arthur charpentier
Just a short post, to share some codes used to generate animated graphs, with R. Assume that we would like to illustrate the law of large number, and the convergence of the average value from binomial sample. We can generate samples  using
using
Each row  will be a trajectory of heads and tails. For each trajectory, define the mean
  , which will denote the mean of the first
  values. Such a matrix can be computed using
Define then
Now, to generate an animated gif, the way I usually do it is to generate graphs (png graphs) using a loop,
I start at 100 because afterwards, when merging files, it is better to have (really) consecutive numbers, since sometimes, the lexical order is used, i.e. after 1 is 10, then 100, etc. Then I use Terminal commands
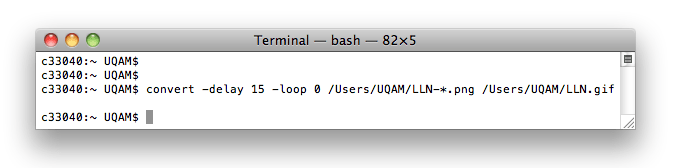
Here, the delay is in /100 seconds, and I use an infinite loop. The graph is here
It is possible to use
But the loop can be used also to generate several graphs, and to produce an animated graph in a pdf document (slides or lecture notes). The idea is to use the same code, but the output is here a pdf graph.
We can then import them in LaTeX,
This will generate the following pdf file. This animate package is described in several forums, e.g. http://www.geogebra.org/…

Arthur CharpentierArthur Charpentier, professor in Montréal, in Actuarial Science. Former professor-assistant at ENSAE Paristech, associate professor at Ecole Polytechnique and assistant professor in Economics at Université de Rennes 1. Graduated from ENSAE, Master in Mathematical Economics (Paris Dauphine), PhD in Mathematics (KU Leuven),


 扫码加好友,拉您进群
 全部版块
全部版块 我的主页
我的主页

 收藏
收藏


