本帖隐藏的内容
After you have fit a linear model using regression analysis, ANOVA, or design of experiments (DOE), you need to determine how well the model fits the data. To help you out, Minitab statistical software presents a variety of goodness-of-fit statistics. In this post, you will explore the R-squared (R2 ) statistic, some of its limitations, and uncover some surprises along the way. For instance, low R-squared values are not always bad and high R-squared values are not always good!
What Is Goodness-of-Fit for a Linear Model? Definition: Residual = Observed value - Fitted value
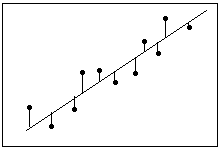
Linear regression calculates an equation that minimizes the distance between the fitted line and all of the data points. Technically, ordinary least squares (OLS) regression minimizes the sum of the squared residuals.
In general, a model fits the data well if the differences between the observed values and the model's predicted values are small and unbiased.
Before you look at the statistical measures for goodness-of-fit, you should check the residual plots. Residual plots can reveal unwanted residual patterns that indicate biased results more effectively than numbers. When your residual plots pass muster, you can trust your numerical results and check the goodness-of-fit statistics.
What Is R-squared?R-squared is a statistical measure of how close the data are to the fitted regression line. It is also known as the coefficient of determination, or the coefficient of multiple determination for multiple regression.
The definition of R-squared is fairly straight-forward; it is the percentage of the response variable variation that is explained by a linear model. Or:
R-squared = Explained variation / Total variation
R-squared is always between 0 and 100%:
- 0% indicates that the model explains none of the variability of the response data around its mean.
- 100% indicates that the model explains all the variability of the response data around its mean.
In general, the higher the R-squared, the better the model fits your data. However, there are important conditions for this guideline that I’ll talk about both in this post and my next post.
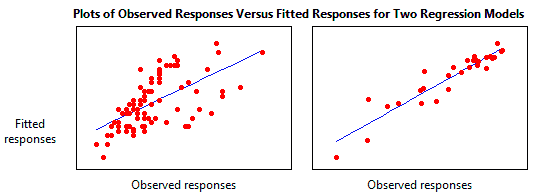
Graphical Representation of R-squaredPlotting fitted values by observed values graphically illustrates different R-squared values for regression models.

The regression model on the left accounts for 38.0% of the variance while the one on the right accounts for 87.4%. The more variance that is accounted for by the regression model the closer the data points will fall to the fitted regression line. Theoretically, if a model could explain 100% of the variance, the fitted values would always equal the observed values and, therefore, all the data points would fall on the fitted regression line.
To learn more about regression analysis, click here.

 扫码加好友,拉您进群