全部版块 我的主页
论坛 数据科学与人工智能 数据分析与数据科学 R语言论坛
6323 20
2010-11-02
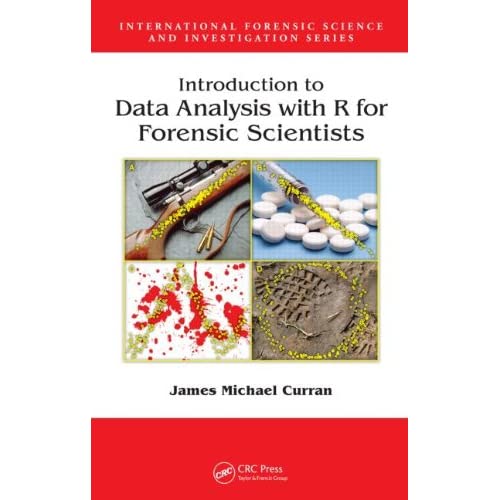
[size=120%]Introduction to Data Analysis with R for Forensic Scientists
By James Michael Curran


  • Publisher: CRC Press
  • Number Of Pages: 331
  • Publication Date: 2010-07-30
  • ISBN-10 / ASIN: 1420088262
  • ISBN-13 / EAN: 9781420088267
Product Description:Statistical methods provide a logical, coherent framework in which data from experimental science can be analyzed. However, many researchers lack the statistical skills or resources that would allow them to explore their data to its full potential. Introduction to Data Analysis with R for Forensic Sciences minimizes theory and mathematics and focuses on the applicationand practice of statistics to provide researchers with the dexterity necessary to systematically analyze data discovered from the fruits of their research.Using traditional techniques and employing examples and tutorials with real data collected from experiments, this book presents the following critical information necessary for researchers:A refresher on basic statistics and an introduction to R Considerations and techniques for the visual display of data through graphics An overview of statistical hypothesis tests and the reasoning behind them A comprehensive guide to the use of the linear model, the foundation of most statistics encountered An introduction to extensions to the linear model for commonly encountered scenarios, including logistic and Poisson regression Instruction on how to plan and design experiments in a way that minimizes cost and maximizes the chances of finding differences that may existFocusing on forensic examples but useful for anyone working in a laboratory, this volume enables researchers to get the most out of their experiments by allowing them to cogently analyze the data they have collected, saving valuable time and effort.
附件列表
二维码

扫码加我 拉你入群

请注明:姓名-公司-职位

以便审核进群资格,未注明则拒绝

全部回复
2010-11-2 03:11:40
Table of Contents
Contents
1. Introduction
  • 1.1 Who is this book for?
  • 1.2 What this book is not about
  • 1.3 How to read this book
    • 1.3.1 Examples and tutorials
  • 1.4 How this book was written
  • 1.5 Why R?
    • 1.5.1 R is free
    • 1.5.2 R does not have to be installed into system directories
    • 1.5.3 R is extensible
    • 1.5.4 R has a high-quality graphics system
    • 1.5.5 R allows you to share your analyses with others
2. Basic statistics
  • 2.1 Who should read this chapter?
  • 2.2 Introduction
  • 2.3 Definitions
    • 2.3.1 Data sets, observations, and variables
    • 2.3.2 Types of variables
  • 2.4 Simple descriptive statistics
    • 2.4.1 Labeling the observations
    • 2.4.2 The sample mean, standard deviation, and variance
    • 2.4.3 Order statistics, medians, quartiles, and quantiles
  • 2.5 Summarizing data
    • 2.5.1 An important question
    • 2.5.2 Univariate data analysis
    • 2.5.3 Three situations
    • 2.5.4 Two categorical variables
    • 2.5.5 Comparing groups
    • 2.5.6 Two quantitative variables
    • 2.5.7 Closing remarks for the chapter
  • 2.6 Installing R on your computer
  • 2.7 Reading data into R
    • 2.7.1 read.csv
    • 2.7.2 scan and others
  • 2.8 The dafs package
  • 2.9 R tutorial
3. Graphics
  • 3.1 Who should read this chapter?
  • 3.2 Introduction
    • 3.2.1 A little bit of language
  • 3.3 Why are we doing this?
  • 3.4 Flexible versus "canned"
  • 3.5 Drawing simple graphs
    • 3.5.1 Basic plotting tools
    • 3.5.2 The histogram
    • 3.5.3 Kernel density estimates
    • 3.5.4 Box plots
    • 3.5.5 Scatter plots
    • 3.5.6 Plotting categorical data
    • 3.5.7 One categorical and one continuous variable
    • 3.5.8 Two quantitative variables
  • 3.6 Annotating and embellishing plots
    • 3.6.1 Legends
    • 3.6.2 Lines and smoothers
    • 3.6.3 Text and point highlighting
    • 3.6.4 Color[color=#0aef0 ! important]
    • 3.6.5 Arrows, circles, and everything else
  • 3.7 R graphics tutorial
    • 3.7.1 Drawing bar plots
    • 3.7.2 Drawing histograms and kernel density estimates
    • 3.7.3 Drawing box plots
    • 3.7.4 Drawing scatter plots
    • 3.7.5 Getting your graph out of R and into another program
  • 3.8 Further reading
4. Hypothesis tests and sampling theory
  • 4.1 Who should read this chapter?
  • 4.2 Topics covered in this chapter
  • 4.3 Additional reading
  • 4.4 Statistical distributions
    • 4.4.1 Some concepts and notation
    • 4.4.2 The normal distribution
    • 4.4.3 Student's t-distribution
    • 4.4.4 The binomial distribution
    • 4.4.5 The Poisson distribution
    • 4.4.6 The X2-distribution
    • 4.4.7 The F-distribution
    • 4.4.8 Distribution terminology
  • 4.5 Introduction to statistical hypothesis testing[color=#0aef0 ! important]

    • 4.5.1 Statistical inference
    • 4.5.2 A general framework for hypothesis tests
    • 4.5.3 Confidence intervals
    • 4.5.4 Statistically significant, significance level, significantly different, confidence, and other confusing phrases
    • 4.5.5 The two sample t-test
    • 4.5.6 The sampling distribution of the sample mean and other statistics
    • 4.5.7 The X2-test of independence
  • 4.6 Tutorial
5. The linear model
  • 5.1 Who should read this?
  • 5.2 How to read this chapter
  • 5.3 Simple linear regression
    • 5.3.1 Example 5.1—Manganese and barium
    • 5.3.2 Example 5.2—DPD and age estimation
    • 5.3.3 Zero intercept models or regression through the origin
    • 5.3.4 Tutorial
  • 5.4 Multiple linear regression
    • 5.4.1 Example 5.3—Range of fire estimation
    • 5.4.2 Example 5.4—Elemental concentration in beer bottles
    • 5.4.3 Example 5.5—Age estimation from teeth
    • 5.4.4 Example 5.6—Regression with derived variables
    • 5.4.5 Tutorial
  • 5.5 Calibration in the simple linear regression case
    • 5.5.1 Example 5.7—Calibration of RI measurements
    • 5.5.2 Example 5.8—Calibration in range of fire experiments
    • 5.5.3 Tutorial
  • 5.6 Regression with factors
    • 5.6.1 Example 5.9—Dummy variables in regression
    • 5.6.2 Example 5.10—Dummy variables in regression II
    • 5.6.3 A pitfall for the unwary
    • 5.6.4 Tutorial
  • 5.7 Linear models for grouped data—One-way ANOVA
    • 5.7.1 Example 5.11—RI differences
    • 5.7.2 Three procedures for multiple comparisons
    • 5.7.3 Dropping the assumption of equal variances
    • 5.7.4 Tutorial
  • 5.8 Two-way ANOVA
    • 5.8.1 The hypotheses for two-way ANOVA models
    • 5.8.2 Example 5.14—DNA left on drinking containers
    • 5.8.3 Tutorial
  • 5.9 Unifying the linear model
    • 5.9.1 The ANOVA identity
6. Modeling count and proportion data
  • 6.1 Who should read this?
  • 6.2 How to read this chapter
  • 6.3 Introduction to GLMs
  • 6.4 Poisson regression or Poisson GLMs
    • 6.4.1 Example 6.1—Glass fragments on the ground
  • 6.5 The negative binomial GLM
    • 6.5.1 Example 6.2—Over–dispersed data
    • 6.5.2 Example 6.3—Thoracic injuries in car crashes
    • 6.5.3 Example 6.4—Over-dispersion in car crash data
    • 6.5.4 Tutorial
  • 6.6 Logistic regression or the binomial GLM
    • 6.6.1 Example 6.5—Logistic regression for SIDS risks
    • 6.6.2 Logistic regression with quantitative explanatory variables
    • 6.6.3 Example 6.6—Carbohydrate deficient transferrin as a predictor of alcohol abuse
    • 6.6.4 Example 6.7—Morphine concentration ratios as a predictor of acute morphine deaths
    • 6.6.5 Example 6.8—Risk factors for thoracic injuries
    • 6.6.6 Pitfalls for the unwary
    • 6.6.7 Example 6.9—Complete separation of the response in logistic regression
    • 6.6.8 Tutorial
  • 6.7 Deviance
7. The design of experiments
  • 7.1 Introduction
  • 7.2 Who should read this chapter?
  • 7.3 What is an experiment?
  • 7.4 The components of an experiment
    • 7.4.1 Questions of interest?
    • 7.4.2 Response variables
    • 7.4.3 Treatment factors
    • 7.4.4 Experimental units
    • 7.4.5 Structure in experimental units
    • 7.4.6 Assignment of treatments to experimental units
  • 7.5 The principles of experimental design
    • 7.5.1 Replication
    • 7.5.2 Blocking
    • 7.5.3 Randomization
  • 7.6 The description and analysis of experiments
  • 7.7 Fixed and random effects
  • 7.8 Completely randomized designs
    • 7.8.1 Examples
  • 7.9 Randomized complete block designs
    • 7.9.1 Block structure
    • 7.9.2 Data model for RCBDs
    • 7.9.3 Randomized block designs and repeated measures experiments
  • 7.10 Designs with fewer experimental units
    • 7.10.1 Balanced incomplete block designs
    • 7.10.2 2[sup(p)] factorial experiments
  • 7.11 Further reading
Bibliography
二维码

扫码加我 拉你入群

请注明:姓名-公司-职位

以便审核进群资格,未注明则拒绝

2010-11-2 06:57:15
谢谢楼主的热心!
二维码

扫码加我 拉你入群

请注明:姓名-公司-职位

以便审核进群资格,未注明则拒绝

2010-11-2 09:22:28
谢谢,亲爱的楼主!
二维码

扫码加我 拉你入群

请注明:姓名-公司-职位

以便审核进群资格,未注明则拒绝

2010-11-2 18:13:24
Very good book. Thanks
二维码

扫码加我 拉你入群

请注明:姓名-公司-职位

以便审核进群资格,未注明则拒绝

2010-11-3 10:05:40
多谢楼主!
二维码

扫码加我 拉你入群

请注明:姓名-公司-职位

以便审核进群资格,未注明则拒绝

点击查看更多内容…
相关推荐
栏目导航
热门文章
推荐文章

说点什么

分享

扫码加好友,拉您进群
各岗位、行业、专业交流群