经管之家App
让优质教育人人可得
立即打开


| Useful Economic and Financial Indicators with Links: |
Oil prices |
| WTI | BRENT | Russian Export Blend Crude Oil (REBCO) Futures |
View the full CL00 chart at Wikinvest | View the full SC00 chart at Wikinvest | View the full RE chart at Wikinvest |
Commodities prices and CRB Index |
| ||||||||||||||||||
| Commodities Market Summary | |
 | Gadgets powered by Google |
View the full CRB chart at Wikinvest
Russian Oil Production: Overview and Data |
|


Gasoline Prices |


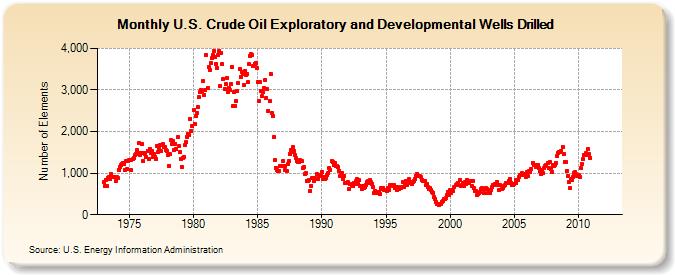
US Monthly Crude Oil and Natural Gas Exploratory and Development Wells |
(Data and charts from EIA-DOE)

US Annual Real Cost of Crude Oil and Natural Gas Wells Drilled |


Monthly US Percent Utilization of Refinery Operable Capacity |

Monthly US Rotary Rigs in Operation |


US Crude Oil Input Quality |


Baltic Exchange Indices |
Index type vessel size BCI bulk carrier 172,000 dwt iron ore, coal BPI bulk carrier 74,000 dwt coal, grain BSI bulk carrier 52,000 dwt grain, fertilizer, coal etc. BHSI bulk carrier 28,000 dwt steel, fertilizer, grain etc. BDTI tanker 105-300,000 dwt crude oil BCTI tanker 22-75,000 dwt oil products BLPG gas tanker 57,000 cbm LPG, butane, methane Palm Oil veg oil tanker 47,000 dwt palm oil ConTex container vessel 1100-2500 teu container HAX container vessel 299-3400 teu container SCFI container 20' container containerised goods
cargo
(Note 1: Deadweight tonnage -often abbreviated as DWT for deadweight tonnes- is the displacement at any loaded condition minus the lightship weight. It includes the crew, passengers, cargo, fuel, water, and stores. It is often expressed in long tons or in metric tons. See "Tonnage" in Wikipedia fore more details.
Note 2: The twenty-foot equivalent unit (often TEU or teu) is an inexact unit of cargo capacity often used to describe the capacity of container ships and container terminals. It is based on the volume of a 20-foot-long (6.1 m) intermodal container, a standard-sized metal box which can be easily transferred between different modes of transportation, such as ships, trains and trucks. See Wikipedia for details.
Note 3: cbm in this case stands for cubic meter.)
BALTIC DRY INDEX
View the full BDIY chart at Wikinvest


Bunkerworld Indices |


Other Tanker Indices and Ship Tracking Services |
Vix Index |
View the full VIX chart at Wikinvest
Real Time Key Financial Ratios (Over a 3-year sample) + Long Term Historical Charts |
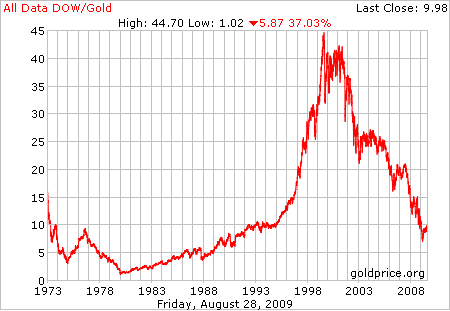
80 years - Dow Gold Ratio.
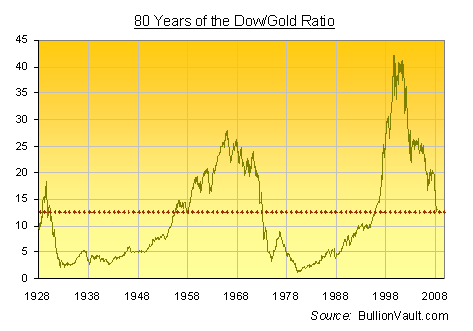
200 years - Dow Gold Ratio (Source: http://www.sharelynx.com )

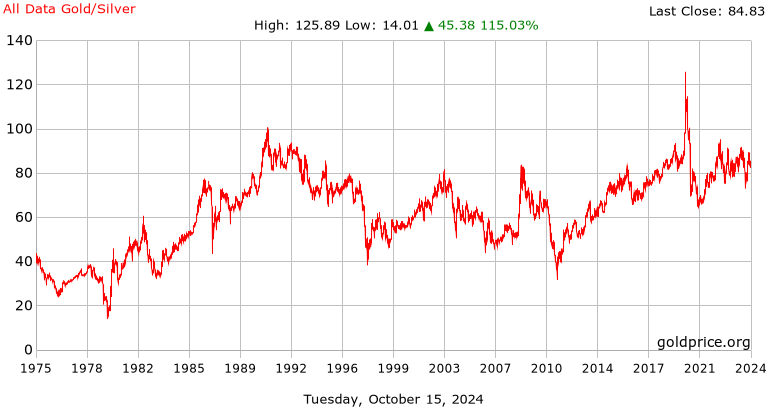
20 year gold silver ratio
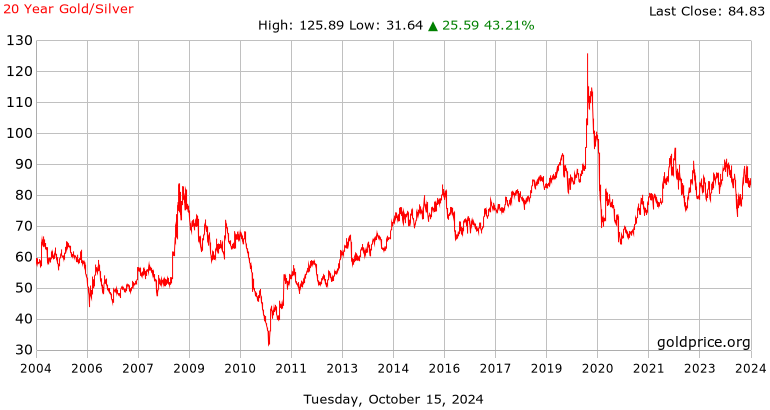
36 year gold silver ratio

Individuals receiving FOOD STAMPS in the US |


Employment Index by Monster.com |


ECRI Weekly Leading Index |

Philly Fed's Aruoba-Diebold-Scotti Business Conditions Index (ADS) |

Chicago Fed's National Activity Index (CFNAI) |


| US National Debt | |
| Gadgets powered by Google |
| US Largest Budget Items | |
| Gadgets powered by Google |
| US Population / Employment Clock | |
| Gadgets powered by Google |
The Financial Forecast Center |


Economic Calendar |
| Forex Economic Calendar | |
| Gadgets powered by Google |
Currency Informer (Belarus,Russia, Ukraine) |
| Currency informer | |
| Gadgets powered by Google |
Currencies (Ranks, Flat rates, Cross Rates, Changes, Historical) |
| CURRENCIES | |
| Gadgets powered by Google |
Commodities and Futures (Energy, Metals, Grains, Livestock,Softs) |
| COMMODITIES AND FUTURES | |
| Gadgets powered by Google |
FAO Food Price Index and Commodities Price Indices |


FFinancial Times News |
| Financial Times | |
| Gadgets powered by Google |
Google News |
| Google News | |
| Gadgets powered by Google |
Bloomberg News Podcasts |
| Bloomberg News Podcasts | |
| Gadgets powered by Google |
Futures (Global Summary) |
| _Futures_ | |
| Gadgets powered by Google |
Macroaxis Symbol Search |
| Macroaxis Symbol Search | |
| Gadgets powered by Google |
Market Movers |
| Market Movers | |
| Gadgets powered by Google |
SP500 Chart |
| S&P 500 Chart | |
| Gadgets powered by Google |
World Indices (Americas, Europe, Asia/Pacific, Africa/Mid. East) |
| World Indices | |
| Gadgets powered by Google |
Intraday World Market Summary/font> |
| Intraday Word Market Summary | |
| Gadgets powered by Google |
Car Sector Summary |
| Car Sector Summary | |
| Gadgets powered by Google |
Real Time Forex Charts |
| Real Time Forex Charts | |
| Gadgets powered by Google |
Real Time Company News |
| Real-time Company News | |
| Gadgets powered by Google |
Real Time chart Ruble/USD |
Gadgets powered by Google| Погода России, weather Russia, meteo forecast Russia | |
| Gadgets powered by Google |
|
|

 | Dean Fantazzini Деан Фантаццини Date of Birth: 06 August 1976 Address: Moscow School of Economics 1, Building 61, Leninskie Gory, M.V. Lomonosov MSU, Moscow, Russia, 119992
- Associate Professor in Econometrics and Finance (Доцент) Moscow School of Economics - Moscow State University |  Московская школа экономики | |
|
| Work Experience | |
| - Oct. 2008 | Associate Professor in Econometrics and Finance - Moscow School of Economics, Moscow State University, Moscow (Russia) 28/04/2009: Award for fruitful scientific research and teaching activities given to me by the former USSR president and Nobel Peace Prize winner Mikhail S. Gorbachev and by the MSU rector prof. Viktor A.Sadovnichy |
| - Oct. 2009 | Visiting Professor - Faculty of Economics, Higher School of Economics - Moscow (Russia) |
| - March 08 - March 2010 | Ernst & Young - Academy of Business, Moscow (Russia) |
| - Oct. 2007 -Sept. 2008 | Lecturer in Econometrics and Finance - Moscow School of Economics, Moscow State University, Moscow (Russia) |
| - Nov. 2006 - Oct. 2007 | Research Fellow in Statistics - Department of Statistics and Applied Economics, University of Pavia (Italy). |
| - Dec. 2005 - Nov. 2006 | Research Fellow in Economics and Econometrics - Department of Economics and Quantitative Methods, University of Pavia (Italy). |
| - March 2005 - July 2005 | Fixed-term job commissioned by the University of Bologna (Italy), the European Commission and the Italian Ministry of Agriculture, to develop an econometric model for the European and Italian tobacco industry. |
| - Aug. 2003 - Aug. 2004 | Research Fellow at the Chair for Economics and Econometrics, University of Konstanz (Germany). |
| - June 2000 - Dec. 2000 | Research Department of Banca Intesa, as a part of the Master in Financial and Insurance Investments. |
| Education | |
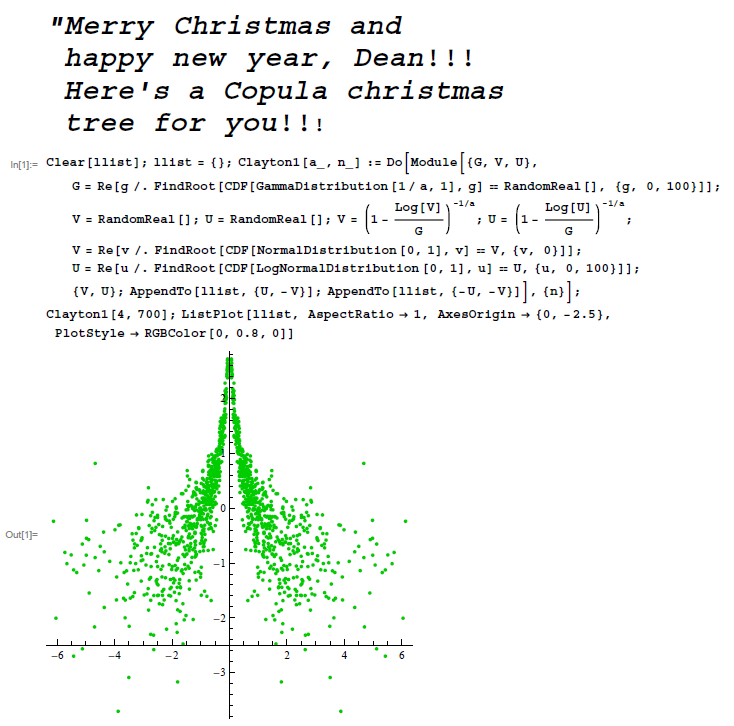
| - Sept. 2002 - Jan. 2006 | Ph.D. in Economics, Department of Political Economy and Quantitative Methods, University of Pavia (Italy). Ph.D. dissertation: "Theory and Applications of Copulas in Finance", Contents Supervisors: prof. L. Bauwens, prof. E. Rossi. Best Ph.D dissertation of the winter session (academic year 2005/2006) and candidate for the Prize awarded to the best Italian Ph.D dissertation in Economics by the Italian Economist Association |
| - Aug. 2003 – Aug. 2004 | Pre-Doc Research position at the Chair for Economics and Econometrics, University of Konstanz (Germany) |
| - Sept.2000 – Nov 2002 | Degree in Political Economics,Department of Economics, University of Bologna (Italy). Final Grade 110/110 cum laude. |
| - Jan. 2000 – Dec. 2000 | Master in Financial and Insurance Investments, Department of Statistics University of Bologna (Italy). Studentship awarded for best Master thesis. |
- Sept.1995 – Nov 1999 | Degree in Business and Economics, Department of Economics, University of Bologna, Final Grade 110/110 cum laude |
| Teaching | |
| Time Series Analysis - Econometrics (Bachelor Course 3rd year- MSE): | Syllabus |
| Time Series Analysis (Master Course 1st year - MSE): | Syllabus |
| Time Series Analysis for Financial Risk Management (Master Course 2nd year - MSE): | Syllabus |
| Stochastic calculus for Finance (Bachelor course 4th year - HSE) | Syllabus |
| Stochastic calculus for Finance and Option Risk Management (Master course 1st year - HSE) | Syllabus |
| Nonlinear Time Series Analysis (Master Course 2nd year - HSE) | Syllabus |


| Publications : |
Articles |
| The Handbook of trading, McGraw-Hill, p. 365-388, (2010) | "Modelling Bubbles and Anti-Bubbles in Bear Markets: A Medium-Term Trading Analysis" You can find the Abstract at SSRNYou can find the book here at McGraw-Hill A long excerpt can be found at Google Books |
| Applied Economics, 42(25), 3267-3277, (2010) | "A Copula-VAR-X approach for Industrial Production Modelling and Forecasting" (with C. Bianchi, A. Carta, M.E. Degiuli, M. Maggi – University of Pavia) Download the published version from Taylor & Francis Download the working paper version from SSRN |
| The BANKING CRISIS Handbook, Chapman & Hall / CRC Finance, p. 383-405, (2010) | "Dangers and Opportunities for the Russian Banking Sector: 2007 - 2008" (with A. Kudrov and A. Zlotnik) You can find the Abstract at SSRNYou can find the book here at Chapman & Hall / CRC Finance An excerpt can be found at Google Books or here The presentation at the first Russian Economic Congress in Moscow (Russia), on December the 11th 2009, can be found at Scribd.com |
| Computational Statistics and Data Analysis, 54(11), 2562-2579 (2010) | "Three-Stage Semi-parametric Estimation of T-Copulas: Asymptotics, Finite-Sample Properties and Computational Aspects" Download the published version from ElsevierDownload the working paper version from SSRN (it contains the full set of tables, plots and proofs not reported in the published version due to space limits) The presentation at the EEA-ESEM 2008 Milan, on August the 28th can be found at Scribd.com |
| The Risk Modeling Evaluation Handbook, McGraw-Hill, p. 339-361, (2010) | "Small-Samples and EVT Estimators for Computing Risk Measures: Simulation and Empirical Evidences" (with A. Kudrov) You can find the Abstract at SSRNYou can find the book here at McGraw-Hill A long excerpt can be found at Google Books |
| The Risk Modeling Evaluation Handbook, McGraw-Hill, p. 321-338, (2010) | "Copula-VAR and Copula-VAR-GARCH Modeling: Dangers for Value at Risk and Impulse Response Functions" (with C. Bianchi, M.E. DeGiuli and M. Maggi) You can find the Abstract at SSRNYou can find the book here at McGraw-Hill A long excerpt can be found at Google Books |
| International Journal of Risk Assessment and Management, 11(1/2), 164-179,(2009) | "Discrete-Time Affine Term Structure Models: An ARCH Formulation" (with A. Carta, and M. Maggi) Download the published version from Inderscience or Ingentaconnect Download the working paper from SSRN |
| EMERGING MARKETS: PERFORMANCE, ANALYSIS AND INNOVATION, Chapman & Hall / CRC Finance, p. 533-554, (2009) | "Market Risk Management for Emerging Markets: Evidence from the Russian Stock Market" You can find the Abstract at SSRNYou can find the book here at Chapman & Hall / CRC Finance A long excerpt can be found at Google Books The presentation at the VII-th International School Seminar "Multivariate Statistical Analysis and Econometrics", Tsahkadzor, Armenia, September 24th 2008, can be found at Scribd.com |
| The VAR IMPLEMENTATION HANDBOOK, McGraw-Hill, p. 253-282, (2009) | "Value at Risk for High-Dimensional Portfolios: A Dynamic Grouped-T Copula Approach" You can find the Abstract at SSRNYou can find the book here at McGraw-Hill A long excerpt can be found at Google Books The presentation at the International Workshop on Computational and Financial Econometrics, Geneva (Switzerland), April 20-22, 2007 can be found at Scribd.com |
| Прикладная эконометрика 2(14), 57-73 (2009) | " Экономические факторы в модели голосования: пример Нидерландов, Великобритании и Израиля" (with Alexei V. Zakharov , - HSE / MSE)You can find the Abstract here |
| Journal of Financial Transformation, 25(1), 31-39, (2009) | "Enhanced Credit Default Models for Heterogeneous SME Segments" (with M.E. DeGiuli, S. Figini, P. Giudici, – University of Pavia).Download the published version from Repec Download the working paper version from SSRN (it contains the full set of tables and plots not reported in the published version due to space limits) |
| Прикладная эконометрика 2(14), 100-127 (2009) | " Управление кредитным риском (окончание)" You can find the Abstract here |
| Прикладная эконометрика 1(13), 105-138 (2009) | "Управление кредитным риском (Продолжение)" You can find the Abstract here |
| Stock Market Volatility, Chapman & Hall / CRC, 527-548,(2009) | "Forecasting Default Probability without Accounting Data: Evidence from Russia" You can find the Abstract at SSRNYou can find the book here at Chapman & Hall / CRC A long excerpt can be found at Google Books |
| International Journal of Risk Assessment and Management, 11(1/2), 138-163,(2009) | "Default forecasting for small-medium enterprises: does heterogeneity matter?" (with S. Figini– University of Pavia). Download the published version from Inderscience or Ingentaconnect |
| Computational Statistics and Data Analysis, 53(6), 2168-2188, (2009) | "The Effects of Misspecified Marginals and Copulas on Computing the Value at Risk: A Monte Carlo Study" Download the published version from Elsevier Download the working paper version from SSRN (it contains the full set of tables not reported in the published version due to space limits) |
| Operational Risk Toward Basel III: Best Practices and Issues in Modeling, Management, and Regulation, Wiley, 197-216, (2009). | "Multivariate Models for Operational Risk: A Copula Approach using Extreme Value Theory and Poisson Shock Models", (with O. Rachedi, Cass Business School, London) You can find the Abstract at SSRN You can find the book here at Wiley A long excerpt can be found at Google Books The presentation at HSE dealing with a general review of Operational Risk Management can be found at Scribd.com |
| Methodology and Computing in Applied Probability 11(1), 29-45 (2009) | "Random Survival Forest models for SME Credit Risk Measurement" (with S. Figini– University of Pavia). Download the published version from Springer Download the working paper version (before revision) from SSRN |
| Прикладная эконометрика 4(12), 84-137 (2008) | " Управление кредитным риском " You can find the Abstract here |
| Прикладная эконометрика 3(11), 87-122 (2008) | " Управление операционным риском " You can find the Abstract here |
| Прикладная эконометрика 2(10), 91-137 (2008) | " Эконометрический анализ финансовых данных в задачах управления риском " You can find the Abstract here |
| Computational Economics 31(2), 161-180, (2008) | “A New Approach for Firm Value and Default Probability Estimation beyond Merton Models” Download the published version from Springer Download the working paper version from SSRN |
| Frontiers in Finance and Economics 5(2), 72-108, (2008) | “Dynamic Copulas for Value at Risk" Download the published version from Repec Download the working paper version from SSRN |
| Operational Risk: A Guide to Basel II Capital Requirements, Models, and Analysis, Wiley, p. 274-277, (2007) | "Empirical Studies with Operational Loss Data: DallaValle, Fantazzini and Giudici Study", You can find the book here at Wiley |
| International Journal of Risk Assessment and Management, 9(3), 238-257,(2008) | “Copulae and Operational Risks”, (with L. Dalla Valle and P. Giudici – University of Pavia). Download the published version from Inderscience or Ingentaconnect Download the working paper from SSRN |
| European Review of Agricultural Economics, 34 (1), 129-131, (2007) | “Leaves and Cigarettes: Modelling the Tobacco Industry (With applications to Italy and Greece)", (with F. Arfini – University of Parma, F. Ferretti – Univesity of Reggio Emilia, K. Mattas – University of Thessaloniki), Book Review by Kenneth J. Thomson. For more details about this book see here . |
| Agribusiness, Landscape and Environmental Management, 10(2), 1-13, (2007) | “Evidence from a Time-Changing Regulated Agricultural Market: The Italian Tobacco Industry” (with F. Ferretti - University of Modena and Reggio Emilia) Abstract |
| (in) S.Co 2005, (edit by C. Provasi), p. 215-220 | “The Econometric Modelling of Copulas: a Review with Extensions ”, Abstract |
| Quaderno di Ricerca, University of Pavia 5, 1-21, (2005) | “Discrete-Time Affine Term Structure: an Econometric Formulation ” |
| Journal of the Italian Society of Financial Risk Management (AIFIRM), 2, 2 -10, (2005) | “Modelli Multivariati per la Gestione dei Rischi Operativi: L'approccio delle Copulae” (i.e. "Multivariate Models for Operational Risk Modelling: The Copulae Approach") pdf (final revised version) |
| Capital Market Notes, Research Department, Banca Intesa, (January / March 2002) | “Investment grade financial corporate bonds: Term structure estimation and relative value”, (with E. Bernini – Banca Intesa). |
| Credit market strategies, Research Department , Banca Intesa, (November 2001) | “Term structure estimation and relative value for European financial names”, (with E. Bernini – Banca Intesa). |
| Collana Ricerche, Studi e Ricerche, Banca Intesa, (September 2001) | “Funzioni spline per la stima di strutture a termine: il caso dei corporate spread finanziari”, (i.e., “Spline functions for term structure estimation: The case of financial corporate spreads”), (with E. Bernini – Banca Intesa). pdf pdf (Appendix - VBA code) |
Books | |
| М.: Экономист, 2010 (в печати) | Методы эконометрики: Том 1: Базовый курс (Айвазян Сергей Артемьевич) Том 2: Продвинутый курс (Айвазян Сергей Артемьевич , Деан Фантаццини). |
| Franco Angeli Editore edited by F. Ferretti (November 2005) | "Leaves and Cigarettes: Modelling the Tobacco Industry (With applications to Italy and Greece)", (with F. Arfini – University of Parma, F. Ferretti – Univesity of Reggio Emilia, K. Mattas – University of Thessaloniki) Cover Contents Introduction |
| Digital University Press (November 2004) | "Financial Markets Microstructure and High Frequency Data: Theoretical Issues, Stylized Facts and Econometric Tools" Cover Contents Introduction |
| Scientific Conferences : | |
| - December 2010 | 4th International Conference on Computational and Financial Econometrics, London (UK) |
| - June 2010 | Workshop Industry & Price Forecasting, Paris (France) |
| - October 2009 | 3rd International Conference on Computational and Financial Econometrics, Limassol (Cyprus) |
| - June 2009 | 40th Seminar in "Multivariate Statistical Analysis and Probabilistic Modelling of Real Processes", Moscow (Russia) |
| - January 2009 | Third Italian Congress of Econometrics and Empirical Economics (ICEEE), Ancona, Italy |
| - September 2008 | VII-th International School Seminar "Multivariate Statistical Analysis and Econometrics", Tsahkadzor, Armenia |
| - August 2008 | "63rd European Meeting of the Econometric Society (ESEM2008)", Milan, Italy |
| - June 2008 | "2nd International Workshop on Computational and Financial Econometrics", Neuchatel, Switzerland |
| - March 2008 | "Mathematical and Statistical Methods for Actuarial Sciences and Finance", Venice, Italy |
| - January 2008 | "Recent Developments in Econometric Methodology", Department of Economics Minsky, University of Bergamo, (Italy). |
| - June 2007 | “5th Infiniti Conference on International Finance", Dublin, Ireland.. |
| - May 2007 | “14th ‘Forecasting Financial Markets’ Conference", Aix-en-Provence, France.. |
| - April 2007 | “International Workshop on Computational and Financial Econometrics", University of Geneva, Switzerland.. |
| - January 2007 | “Second Italian Congress of Econometrics and Empirical Economics", Rimini - Italy. |
| - September 2006 | “XXX Convegno AMASES" (i.e. 30th conference of the Italian Association of Applied Mathematics), Trieste, Italy |
| - June 2006 | “12th international conference on Computing in Economics and Finance", Limassol, Cyprus |
| - May 2006 | “13th International conference on Forecasting Financial Markets", Aix-En-Provence, Fran |
| - April 2006 | “Convegno nazionale sulle serie temporali"(i.e. Italian Conference on Time Series) held by the Italian Society of Statistics, Rome, Italy. |
| - September 2005 | “Fifth Annual Conference of ENBIS - European Network of Business and Industrial Statisticians", Newcastle, England |
| - September 2005 | “Quarto Convegno su Modelli Complessi e Metodi Computazionali Intensivi per la Stima e la Previsione", Bressanone - Italy. |
| - July 2005 | “8th Italian Spanish Meeting on Financial Mathematics", Verbania - Italy. |
| - June 2005 | “Global Finance Conference 2005", Trinity College Dublin - Ireland |
| - May 2005 | “XXXVI Euro Working Group on Financial Modelling", University of Brescia - Italy |
| - January 2005 | “First Italian Congress of Econometrics and Empirical Economics", University of Venice - Italy |
| - November 2004 | Conference in “High Frequency Data: Models and Applications", University of Perugia - Italy |
| - April 2004 | Market Microstructure Workshop, University of Tilburg - Holland |
| Language skills: |
| Computer skills: |
| Scientific areas of Research: |
| Hobbies and Sport: |
| Useful Economic andFinancial Links (separate web page) | |
|
|
 扫码加好友,拉您进群
 全部版块
全部版块 我的主页
我的主页

 收藏
收藏


