以下内容来自R软件帮助文档,查看方式👇
install.packages("patchwork")library(patchwork)??plot_layout
# 重要参数解释plot_layout( ncol = NULL, # 设置列数 nrow = NULL, # 设置行数 byrow = NULL, # 设置案列输出方式 行 or 列 widths = NULL, # 设置宽度 heights = NULL, # 设置高度 guides = NULL, tag_level = NULL, design = NULL)
效果演示
library(ggplot2)library(patchwork)p1 <- ggplot(mtcars) + geom_point(aes(mpg, disp))p2 <- ggplot(mtcars) + geom_boxplot(aes(gear, disp, group = gear))p3 <- ggplot(mtcars) + geom_bar(aes(gear)) + facet_wrap(~cyl)p4 <- ggplot(mtcars) + geom_bar(aes(carb))p5 <- ggplot(mtcars) + geom_violin(aes(cyl, mpg, group = cyl))# The plots are layed out automatically by default# 默认按照行排序p1 + p2 + p3 + p4 + p5# 效果见下图
# Use byrow to change how the grid is filled out# 设置按照列诸葛输出p1 + p2 + p3 + p4 + p5 + plot_layout(byrow = FALSE)# 效果见下图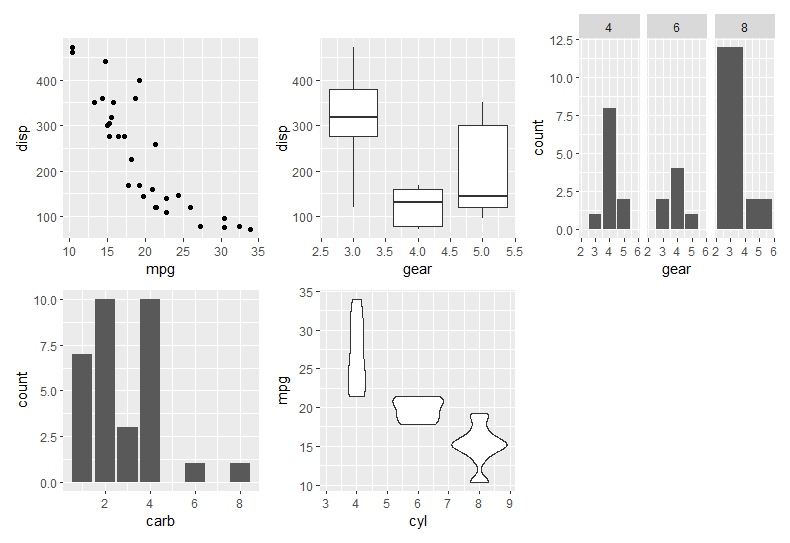
上图 p1 + p2 + p3 + p4 + p5
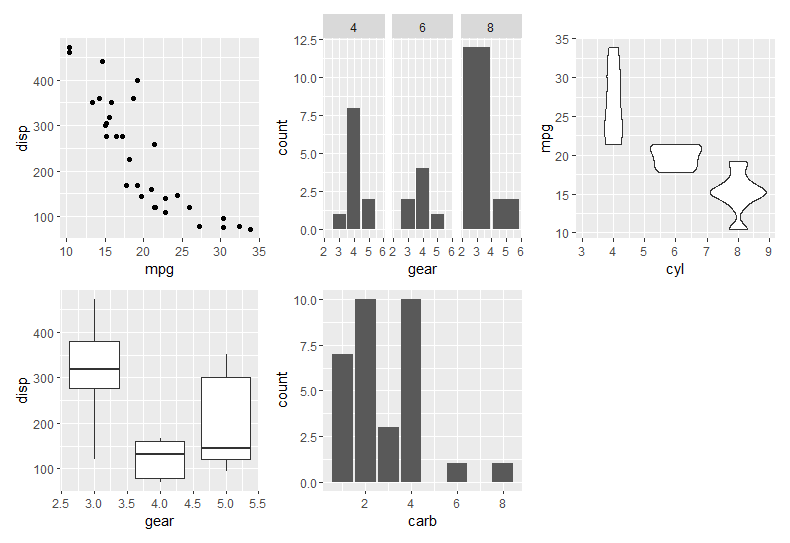
上图 p1 + p2 + p3 + p4 + p5 + plot_layout(byrow = FALSE)
# Change the grid dimensions# 设置布局列数和宽度p1 + p2 + p3 + p4 + p5 + plot_layout(ncol = 2, widths = c(1, 2))# 效果见下图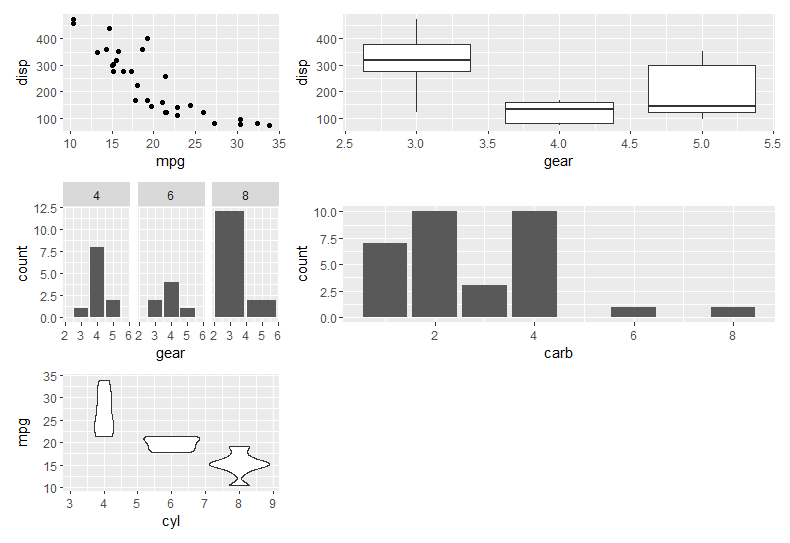
上图 p1 + p2 + p3 + p4 + p5 + plot_layout(ncol = 2, widths = c(1, 2))
# Define layout at different nesting levels# 定义不同嵌套级别的布局p1 + p2 + (p3 + p4 + plot_layout(ncol = 1) ) + p5 + plot_layout(widths = c(2, 1))# 效果见下图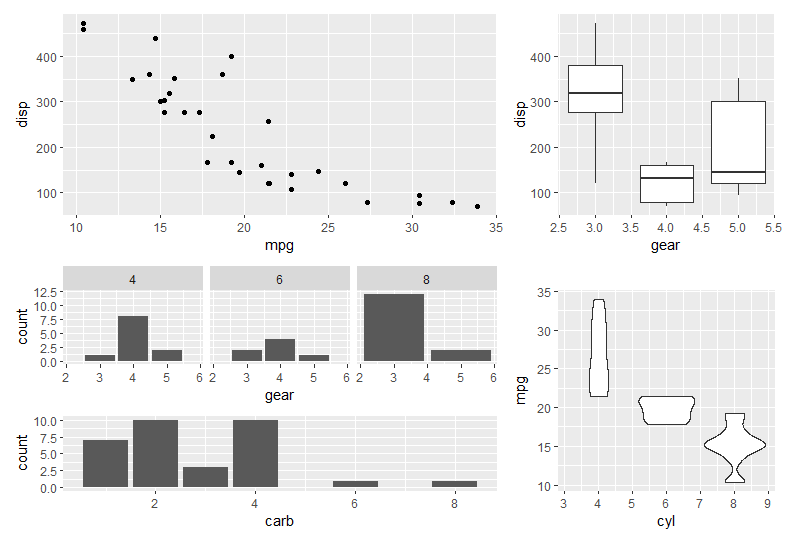
# Complex layouts can be created with the `design` argument#可以使用“design”参数创建复杂的布局design <- c( area(1, 1, 2), area(1, 2, 1, 3), area(2, 3, 3), area(3, 1, 3, 2), area(2, 2))p1 + p2 + p3 + p4 + p5 + plot_layout(design = design)# 效果见下图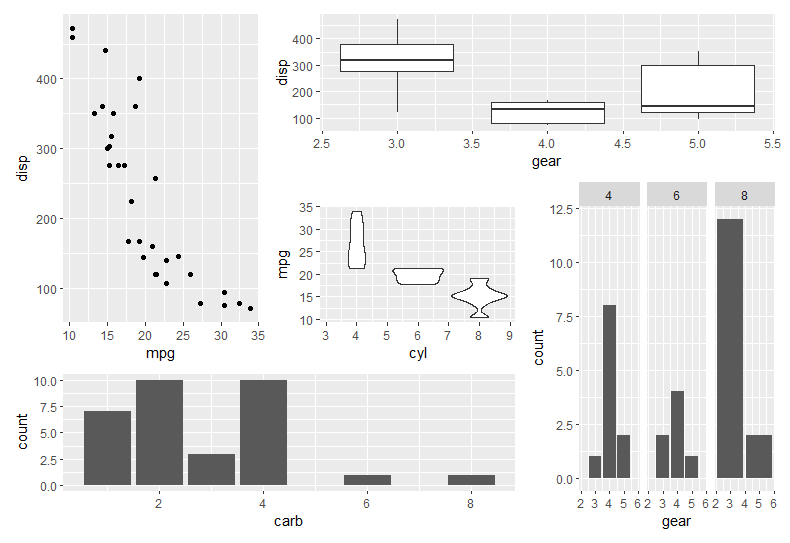
图 p1 + p2 + p3 + p4 + p5 + plot_layout(design = design)
# The same can be specified as a character string:#可以将其指定为字符串:design <- "122153443"p1 + p2 + p3 + p4 + p5 + plot_layout(design = design)# 效果见下图
图 p1 + p2 + p3 + p4 + p5 + plot_layout(design = design)
# When using strings to define the design `#` can be used to denote empty#使用字符串定义设计时,`#`可用于表示空
# areas#区域design <- "1##123##3"p1 + p2 + p3 + plot_layout(design = design)# 效果见下图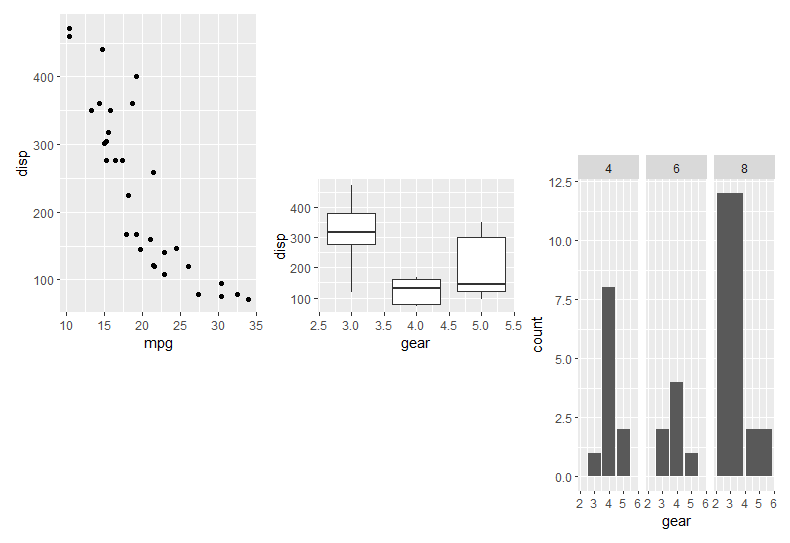
图 p1 + p2 + p3 + plot_layout(design = design)
# Use guides="collect" to remove duplicate guides#使用guides=“collect”删除重复的辅助线p6 <- ggplot(mtcars) + geom_point(aes(mpg, disp, color=cyl))p7 <- ggplot(mtcars) + geom_point(aes(mpg, hp, color=cyl))p6 + p7 + plot_layout(guides='collect')# 效果见下图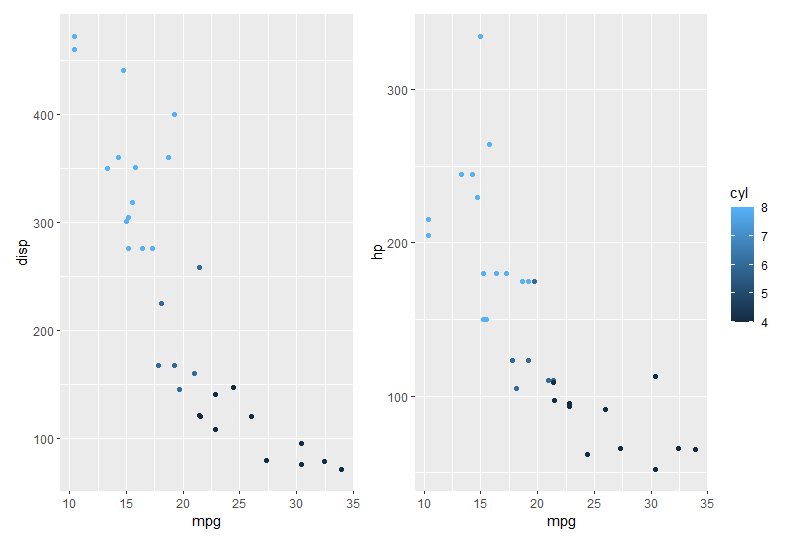
图 p6 + p7 + plot_layout(guides='collect')
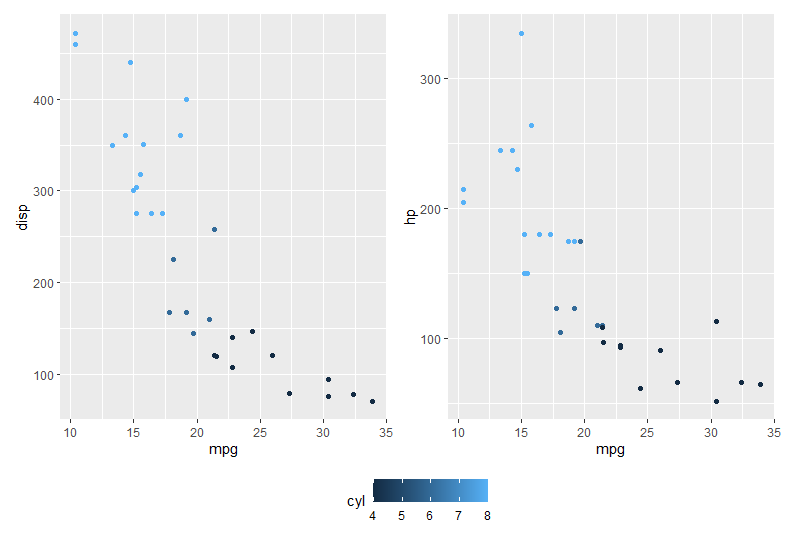
# Guide position must be applied to entire patchwork#导向位置必须应用于整个拼接p6 + p7 + plot_layout(guides='collect') & theme(legend.position='bottom')# 效果见下图

 扫码加好友,拉您进群