1.增加了Slide Bar,最大的好处是,当需要对局部图形进行放大观察时,不用再去调整Sample Range了。
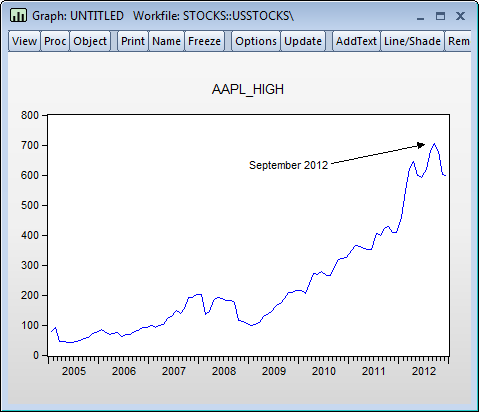
2.对需要强调的东西直接用箭头标出来。
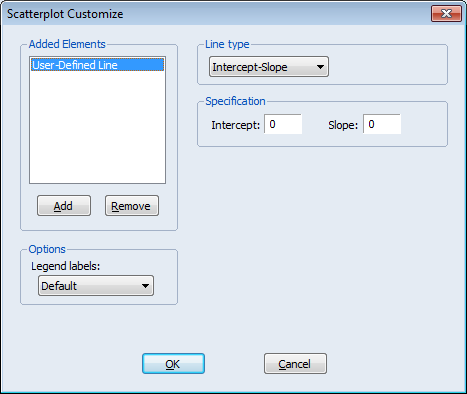
3.在散点图中增加了自定义拟合线。
4.图形、表和筒对象保存格式中增加了PDF和EMF格式。
Graph Sample Slider Bar
EViews 8 graphs now feature a sample slider bar, located at the bottom of a sample based graph window which allows you to adjust dynamically the sample displayed in the graph window by resizing and moving the slider bar:
 Graph Arrows and Lines
It’s often useful to accentuate a data point in a graph or draw a comparison between two points. In EViews 8, you can draw custom straight lines at any angle, anywhere in a frozen graph window. You may also choose from multiple designs for the arrowheads, including none (plain line), filled arrow, and open arrow.
 User-Defined Fit Lines
Just as you may wish to highlight a particular data point in your graph with an arrow, you might like to add custom fit lines to a scatter plot. Earlier versions of EViews supported fit lines drawn using calculations based upon the underlying data. The new fit line option,
User-defined, lets you specify your own definition line definition.
 PDF and Enhanced Metafile Export
The PDF format is one of the most commonly used standards for saving and sharing documents, and is arguably the standard for documents on the web. EViews 8 now supports the saving of graph, table, and spool output to PDF. The options to save as PDF are included in the standard save dialogs for graphs, tables, and spools.
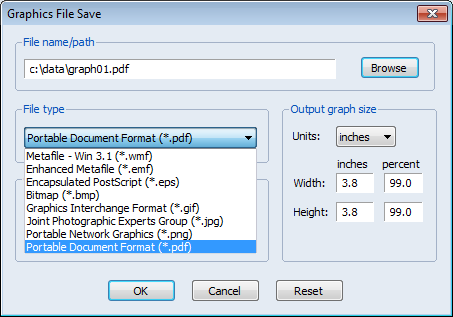
In addition, table output may now be saved to Enhanced Metafile (EMF) format.


 扫码加好友,拉您进群
 全部版块
全部版块 我的主页
我的主页

 收藏
收藏


