某DV博客对此报告的评论
http://apandre.wordpress.com/2014/02/
February 23, 2014
State of DV, Visual Analytics and BI PlatformsPosted by Andrei Pandre under Analytics, Comparison, Popular
1 Comment
For last 6 years every and each February my inbox was bombarded by messages from colleagues, friends and visitors to this blog, containing references, quotes and PDFs to Gartner’s Magic Quadrant (MQ) for Business Intelligence (BI) and Analytics Platforms, latest can be found here: http://www.gartner.com/technology/reprints.do?id=1-1QLGACN&ct=140210&st=sb .Last year I was able to ignore these noises (funny enough I was busy by migrating thousands of users from Business Objects and Microstrategy to Tableau-based Visual Reports for very large company), but in February 2014 I got so many questions about it, that I am basically forced to share my opinion about it.[size=1em]2ndly last 6 MQs (2009-2014) are suspicious for me because in all of them Gartner (with complete disregard of reality) placed all 6 “Misleading” vendors (IBM, SAP, Oracle, SAS, Microstrategy and Microsoft)[size=1em] of wasteful BI platforms in Leaders Quarter! Those 6 vendors convinced customers to buy (over period of last 6 years) their BI software for over $60B plus much more than that was spent on maintenance, support, development, consulting, upgrades and other IT expenses.
There is nothing magic about these MQs: they are results of Gartner’s 2-dimensional understanding of BI, Analytics and Data Visualization (DV) Platforms, features and usage. 1st Measure (X axis) according to Gartner is the “Completeness of Vision” and 2nd Measure (Y axis) is the “Ability to Execute”, which allows to distribute DV and BI Vendors among 4 “Quarters”: RightTop – “Leaders”, LeftTop -”Challengers”, RightBottom – “Visionaires” and LeftBottom – “Niche Players” (or you can say LeftOvers).
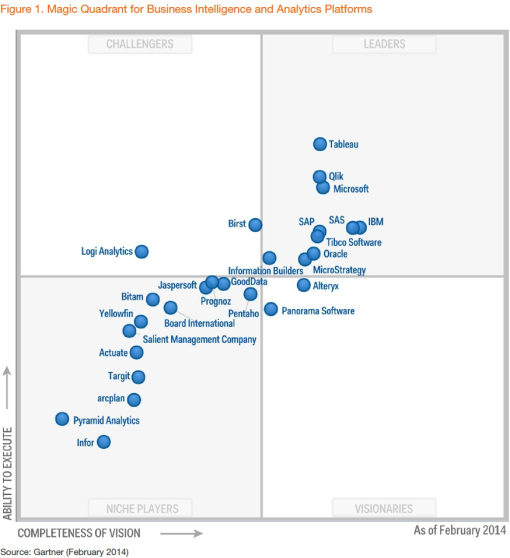
I decided to compare my opinions (expressed on this blog many times) vs. Gartner’s (they wrote 78 pages about it!) by taking TOP 3 Leaders from Gartner, than taking 3 TOP Visionaries from Gartner (Projecting on Axis X all Vendors except TOP 3 Leaders) than taking 3 TOP Challengers from Gartner (Projecting on Axis Y all Vendors except TOP 3 Leaders and TOP 3 Visionaries ) than TOP 3 “Niche Players” from the Rest of Gartner’s List (above) and taking “similar” choices by myself (my list is wider then Gartner’s, because Gartner missed important to me DV Vendors like Visokio and vendors like Datawatch and Advizor Solutions are not included into MQ in order to please Gartner’s favorites), see the comparison of opinions below: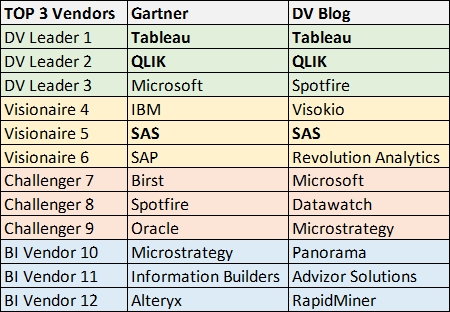 If you noticed, in order to be able to compare my opinion, I had to use Gartner’s terms like Leader, Challenger etc., which is not exactly how I see it. Basically my opinion overlapping with Gartner’s only in 25% of cases in 2014, which is slightly higher then in previous years – I guess success of Tableau and QLIK is a reason for that.BI Market in 2013 reached $14B and at least $1B of it spent on Data Visualization tools. Here is the short Summary of the state of each Vendor, mentioned above in “DV Blog” column:
- Tableau: $232M in Sales, $6B MarketCap, YoY 82% (fastest in DV market), Leader in DV Mindshare, declared goal is “Data to the People” and the ease of use.
- QLIK: $470M in Sales, $2.5B MarketCap, Leader in DV Marketshare, attempts to improve BI, but will remove Qlikview Desktop from Qlik.Next.
- Spotfire: sales under $200M, has the most mature Platform for Visual Analytics, the best DV Cloud Services. Spotfire is limited by corporate Parent (TIBCO).
- Visokio: private DV Vendor with limited marketing and sales but has one of the richest and mature DV functionality.
- SAS: has the most advanced Analytics functionality (not easy to learn and use), targets Data Scientists and Power Users who can afford it instead of free R.
- Revolution Analytics: as the provider of commercial version and commercial support of R library is a “cheap” alternative to SAS.
- Microsoft: has the most advanced BI and DV technological stack for software developers but has no real DV Product and has no plan to have it in the future.
- Datawatch: $33M in sales, $281M MarketCap, has mature DV, BI and real-time visualization functionality, experienced management and sales force.
- Microstrategy: $576M in sales, 1.4B MarketCap; BI veteran with complete BI functionality; recently realized that BI Market is not growing and made the desperate attempt to get into DV market.
- Panorama: BI Veteran with excellent easy to use front-end to Microsoft BI stack, has good DV functionality, social and collaborative BI features.
- Advizor Solutions: private DV Veteran with almost complete set of DV features and ability to do Predictive Analytics interactively, visually and without coding.
- RapidMiner: Commercial Provider of open-source-based and easy to use Advanced Analytical Platform, integrated with R.
Similar MQ for “Advanced Analytics Platforms” can be found here: http://www.gartner.com/technology/reprints.do?id=1-1QXWEQQ&ct=140219&st=sg - have fun: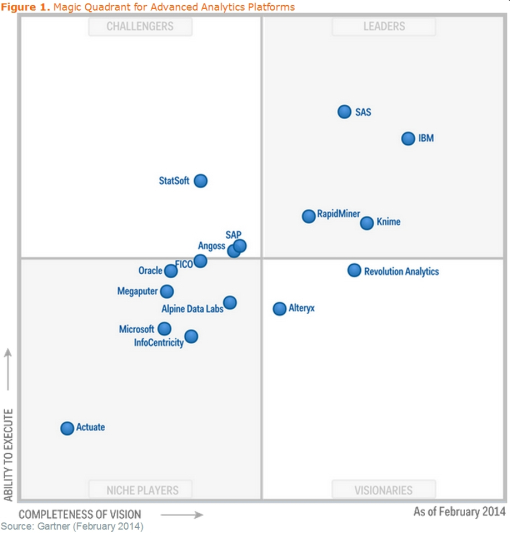
In addition to differences mentioned in table above, I need to say that I do not see that Big Data is defined well enough to be mentioned 30 times in review of “BI and Analytical Platforms” and I do not see that Vendors mentioned by Gartner are ready for that, but may be it is a topic for different blogpost…Update:


 扫码加好友,拉您进群
 全部版块
全部版块 我的主页
我的主页

 收藏
收藏


