A nice post was recently published on the rsnippets blog, about the tikzDevice R package. This package is – indeed – awesome. Even if it has been removed from the CRAN website. Of course, it can be download from the archive folder, on http://cran.r-project.org/…, but also (for a more recent version) on http://download.r-forge.r-project.org/…. But first, it is necessary to install the following package.
Then, we download on of the tikzDevice.zip files, and load it, e.g. using (on Mac)

Then, we can load the library
If we want to use nice LaTeX formulas, it might be necessary to upload some (LaTeX) libraries and to specify the encoding format
(this is detailed, e.g. in http://yihui.name/…), then, we write a code to plot a graph. The idea is to produce a tex file which contains the graph, or more precisely which will produce a pdf graph when we compile it. We start with
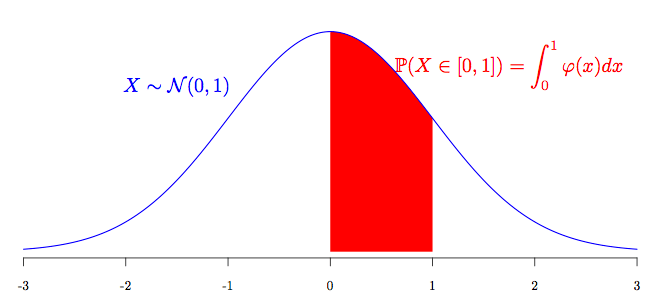
We will produce a 8×4 graph. The graph is the following,
We can add text (or TeX based text)
And we end the file with a standard
This will produce a .tex file. If we compile this file, we can generate a pdf file, that can be inserted in lecture notes, slides or articles,
Nice, isn’t it ?

Arthur CharpentierArthur Charpentier, professor in Montréal, in Actuarial Science. Former professor-assistant at ENSAE Paristech, associate professor at Ecole Polytechnique and assistant professor in Economics at Université de Rennes 1. Graduated from ENSAE, Master in Mathematical Economics (Paris Dauphine), PhD in Mathematics (KU Leuven), and Fellow of the French Institute of Actuaries.


 扫码加好友,拉您进群
 全部版块
全部版块 我的主页
我的主页

 收藏
收藏


