We can use unsupervised machine learning to identify which drugs are associated with which adverse events. Specifically, machine learning can help us to create clusters based on gender, age, outcome of adverse event, route drug was administered, purpose the drug was used for, body mass index, etc. This can help for quickly discovering hidden associations between drugs and adverse events.
Clustering is a non-supervised learning technique which has wide applications. Some examples where clustering is commonly applied are market segmentation, social network analytics, and astronomical data analysis. Clustering is grouping of data into sub-groups so that objects within a cluster have high similarity in comparison to other objects in that cluster, but are very dissimilar to objects in other classes. For clustering, each pattern is represented as a vector in multidimensional space and a distance measure is used to find the dissimilarity between the instances. In this post, we will see how we can use hierarchical clustering to identify drug adverse events. You can read about hierarchical clustering from Wikipedia.
DataLet’s create fake drug adverse event data where we can visually identify the clusters and see if our machine learning algorithm can identify the clusters. If we have millions of rows of adverse event data, clustering can help us to summarize the data and get insights quickly.
Let’s assume a drug AAA results in adverse events shown below. We will see in which group (cluster) the drug results in what kind of reactions (adverse events).
In the table shown below, I have created four clusters:
- Route=ORAL, Age=60s, Sex=M, Outcome code=OT, Indication=RHEUMATOID ARTHRITIS and Reaction=VASCULITIC RASH + some noise
- Route=TOPICAL, Age=early 20s, Sex=F, Outcome code=HO, Indication=URINARY TRACT INFECTION and Reaction=VOMITING + some noise
- Route=INTRAVENOUS, Age=about 5, Sex=F, Outcome code=LT, Indication=TONSILLITIS and Reaction=VOMITING + some noise
- Route=OPHTHALMIC, Age=early 50s, Sex=F, Outcome code=DE, Indication=Senile osteoporosis and Reaction=Sepsis + some noise
Below is a preview of my data. You can download the data here
Hierarchical ClusteringTo perform hierarchical clustering, we need to change the text to numeric values so that we can calculate distances. Since age is numeric, we will remove it from the rest of the variables and change the character variables to multidimensional numeric space.
Create a Matrix
Now, we can add the age column:
Let’s normalize our variables using caret package.
Next, let’s calculate distance and apply hierarchical clustering and plot the dendrogram.
You will get this plot:
[color=rgb(255, 255, 255) !important]
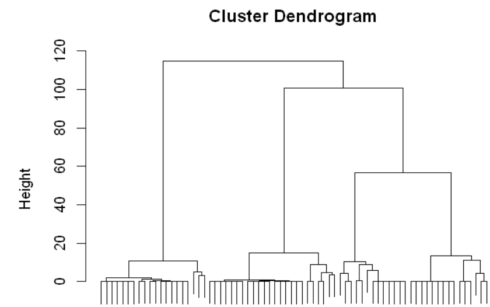
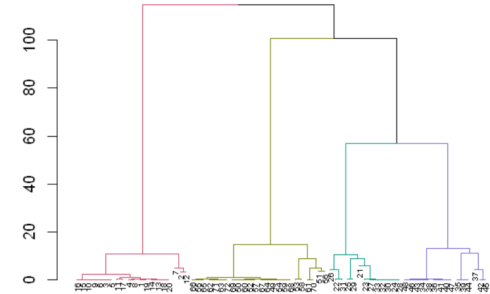
From the dendrogram shown above, we see that four distinct clusters can be created from the fake data we created. Let’s use different colors to identify the four clusters.
Here is the plot:
[color=rgb(255, 255, 255) !important]
Now, let’s create cluster groups with four clusters.
Now, let’s add the clusterGroups column to the original data.
Number of Observations in Each Cluster
What is the most common observation in each cluster?Let’s calculate column average for each cluster.
Next, most common observation in each cluster:
SummaryWe see that we have created the clusters using hierarchical clustering. From cluster 1, for male in the 60s, the drug results in vasculitic rash when taken for rheumatoid arthritis. We can interpret the other clusters similarly. Remember, this data is not real data. It is fake data made to show the application of clustering for drug adverse event study. From, this short post, we see that clustering can be used for knowledge discovery in drug adverse event reactions. Specially in cases where the data has millions of observations, where we cannot get any insight visually, clustering becomes handy for summarizing our data, for getting statistical insights and for discovering new knowledge.


 扫码加好友,拉您进群
 全部版块
全部版块 我的主页
我的主页

 收藏
收藏


