经管之家App
让优质教育人人可得
立即打开


难道国内真没有人会做吗?
我见过外国人做的结果,但不知道是怎么做出来的。
请大家问问各自的导师,看看能不能做,我这里先行谢过了。
At first make clear your question.
Your model has several equations and the data set is panel data. You want to know how to estimate this model.
This is SEM (Simultaneous-Equations Model). You can use 2sls or 3sls to estimate it whatever the data set is panel or not.
But the problem is if the data set is panel, the heteroscedasticity problems are always exist. To increase efficiency, you can use 2SIS-GLS or 3SLS-GlS to estimate this model, here the structure of error terms of GLS estimates follows the property of panel data-- ei`*ei/T. i is the number of groups and T is the number of periods. (chapter 13 Greene)
If you want to calculate the fixed effect in this model, you only need to add dummy variables for each group.(remember fixed effect model is consistant but not efficient if Heteroscedasticity exists. actually it is an OLS with dummy variables)
I do not know which software can do this directly, But SAS/IML can do it by programming.
You can refer the greene's book-- econometric analysis( fifth version chapter 15).
If you have any comments or opinions, please let me know.
感谢楼上的朋友,你理解了我的意思。但我还有一个疑问,一是如果要求随机效应怎么办,如何判断是固定效应还是随机效应?如果要用EVIEWS来做的话,是在面板对象里作还是在系统对象里作呢?
谢谢!
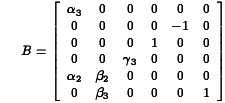
原理和做FEM 是一样的, 区别只在于 当你要做REM, 你要构造适当的OMIGA 矩阵
1. See Greene Page 406 and equation (15-31) for estimating model. (English fifth version )
2. See (15-28) and (14-3) which is how to construct Omega matrix for original 3SLS.
3. See (13-20) and 13-21 for How to construct Omega matrix of REM.
Substitute 3 into 2, and using 1 to estimate your model.
SAS/IML can do it, but you have to write code.
you can still use Hauman test to compare FEM and REM. When you compute the difference of variance and covariance matrix, you should use the Omega matrix you construct as 3.
I don't know how to use Eview.
Discussion of linear simultaneous equations systems may be found in almost all econometric textbooks. For example, Chapter 18 in Estimation and Inference in Econometrics by Russell Davidson and James G. MacKinnon (ISBN 0-19506011-3, Oxford University Press, 1993)
Linear Simultaneous Equations
|| Unconstrained Klein's Model I Example || Constrained Klein's Model I Example ||
Discussion of linear simultaneous equations systems may be found in almost all econometric textbooks. For example, Chapter 18 in Estimation and Inference in Econometrics by Russell Davidson and James G. MacKinnon (ISBN 0-19506011-3, Oxford University Press, 1993), or chapter 19 in Econometric Analysis, 2nd Ed. by William H. Greene (ISBN 0-02-346391-0, Macmillan, 1993).
The linear simultaneous equation model can be represented by the matrix equation:

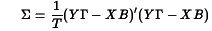
where Y is an TxK matrix of T observations on K endogenous variables, X is an TxL matrix of T observations on L exogenous variables, and  is a KxK matrix of the coefficients among the endogenous variables, B is an LxK matrix of the coefficients of the endogenous variables on the exogenous, and Z is a TxK matrix of unobserved residuals.
Estimates for B and are found by minimizing the log-likelihood:
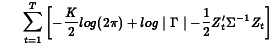
where
Not all of the elements of B and can be estimated. To "identify" the model it is necessary to fix some elements of B and to zero. It is also possible to fix elements of the residual covariance matrix to zero as well. The diagonal of is also fixed to one as a "normalization". See the references above for details about the identification of simultaneous models.
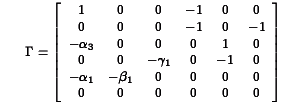
Klein's Model I is a well-known example that is presented in many econometrics textbooks, including the references above. From page 595, Greene (op.cit.) the equations for this model are: where C is consumption, I investment, Wp private wages, X equilibrium demand, P private profits, K capital stock, and where G is government spending, T is indirect business taxes plus net exports, Wg is the government wage bill, A is time trend measured from 1931. For this model, we get and and because the last three equations in the model are identities, the last three columns and rows in the residuals covariance matrix are fixed to zeros. The program for estimating the coefficients in this model, klein.prg,is written in the GAUSS programming language and uses Aptech System's Maximum Likelihood (MAXLIK) applications module. Estimates are produced for a 22 year time series of 9 variables of the U.S. economy from 1920 through 1941. The results are presented in klein.out Klein's Model I is a dynamic model because it contains autoregression coefficients, i.e., coefficients of endogenous variables on their values at a previous point in time. For such a model to be dynamically "stable" or stationary, the model estimates must satisfy a certain condition. Let For our estimates of Klein's Model I, we have and the absolute values of the eigenvalues of which are This confirms the stability of the model implied by our estimates. ||Top||HomePage|| Greene's book (op.cit.) contains an additional 32 years of data for Klein's Model I. Estimating the model with this additional data presents some difficulties that require the special features of Aptech System's Constrained Maximum Likelihood (CML) applications module. First, the data are highly correlated, causing difficulty for the estimation process, and second, the unconstrained estimation produces estimates that imply an unstable system. To deal with the first problem, CML is used to bound the coefficient estimates. For bounds we will use the 99% confidence limits from the analysis of the 1931 to 1942 data. For the second problem we will use CML to constrain the eigenvalues of The program for estimating the coefficients in this model, cklein.prg,is written in the GAUSS programming language and uses Aptech System's Constrained Maximum Likelihood (CML) applications module. Estimates are produced for the original 22 year time series of 9 variables of the U.S. economy from 1920 through 1941 plus in addition, the 32 year time series. The results are presented in klein.out The results of our stability test are: The Lagrangean coefficients associated with the constraints on these eigenvalues are: indicating that the model estimates are on the stability boundary.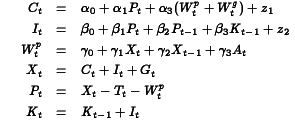
 be the submatrix of B associated with the relationships of the endogenous variables to the exogenous variables that are their lagged versions. Then stability requires that the eigenvalues of
  be less than one in absolute value.
0.0000 0.0000 0.0000 0.0420 0.4911 0.4911
to be less than one in absolute value. 0.0000 0.0000 0.0000 0.0026 0.9627 0.9627
0.0000 0.0000 0.0000 1.9556 0.0000 0.0000
Klein's model is a classic example of simultaneous equstions models. But the data set of Klein's model is not panel.
SEM can be estimated by 3SLS-GLS. Many softwares such as SAS, LImdep and Stata can estimate it directly (just a command).
But in this case, You want to get fixed effect and random effect of panel data, you have to use some different strateages.
I do not use 3SLS to estimate a panel data set, but i think my way is feasible. If you have any comments and criticals about it, please let me know.
Dear listers:
I need to estimate simultaneous equation model for panel data.(two linear regression models with correlated error is enough). I searched help and archive, but could not locate any information. How can I estimate such a model on Stata? I appreciate any information.Thanks in advance!
Dear listers:
I need to estimate simultaneous equation model for panel data.(two linear regression models with correlated error is enough). I searched help and archive, but could not locate any information. How can I estimate such a model on Stata? I appreciate any information.Thanks in advance!
Kim,
Stata doesn't have a built-in routine for panel data simultaneous
equations. Maybe someone out there has written their own program for
this, but when I did -findit panel simultaneous- nothing came up.
If you can transform or recast your model into a non-panel framework
(e.g., by transforming into deviations from means or using explicit
dummies for observational units) you could use -reg3- to do 3-stage
least squares.
The alternative is to estimate the system equation-by-equation using
-xtreg- or -xtabond- or -xtivreg- or whatever. It won't be efficient
(in the way that a system estimator like -reg3- is) but your results
will be consistent, and will have the usual advantage over system
estimation in that if one equation is misspecified, it won't spill
over and contaminate the estimation results for the other equation.
Hope this helps.
Prof. Mark E. Schaffer
Director
Centre for Economic Reform and Transformation
Department of Economics
School of Management & Languages
Heriot-Watt University, Edinburgh EH14 4AS UK
44-131-451-3494 direct
44-131-451-3008 fax
44-131-451-3485 CERT administrator
http://www.som.hw.ac.uk/cert
Soo-Bin Park
Department of Economics, Carleton University
[此贴子已经被作者于2006-4-24 13:20:49编辑过]
A panel data simultaneous equation model with a dependent categorical variable and selectivity
Description
This article develops a Bayesian Markov chain Monte Carlo algorithm to estimate a panel data simultaneous equations model with a dependent categorical variable and selectivity. In contrast with previous Bayesian analysis of selectivity models, the algorithm does not require the explanatory variables to be observed when the value of the dependent variable is missing. This makes the algorithm applicable to studies of the labor market where there are typically missing regressors. In addition, the article provides an scheme to sample the slope parameters using an analytical approximation of the posterior distribution as a proposal density. Estimation with a simulated...
[此贴子已经被作者于2006-4-24 13:18:27编辑过]
Kim,
Stata doesn't have a built-in routine for panel data simultaneous
equations. Maybe someone out there has written their own program for
this, but when I did -findit panel simultaneous- nothing came up.
If you can transform or recast your model into a non-panel framework
(e.g., by transforming into deviations from means or using explicit
dummies for observational units) you could use -reg3- to do 3-stage
least squares.
The alternative is to estimate the system equation-by-equation using
-xtreg- or -xtabond- or -xtivreg- or whatever. It won't be efficient
(in the way that a system estimator like -reg3- is) but your results
will be consistent, and will have the usual advantage over system
estimation in that if one equation is misspecified, it won't spill
over and contaminate the estimation results for the other equation.
Hope this helps.
Prof. Mark E. Schaffer
Director
Centre for Economic Reform and Transformation
Department of Economics
School of Management & Languages
Heriot-Watt University, Edinburgh EH14 4AS UK
44-131-451-3494 direct
44-131-451-3008 fax
44-131-451-3485 CERT administrator
http://www.som.hw.ac.uk/cert
Thanks Trevor. I am very comfortable with this answer. The last part is the same as greene's book(p413 fifth version).
The key point is that you can estimate them one by one if you do not concern lossing some efficience or you can estimate it using 3sls by programming. My answer is about how to program it though i do not whether it is right or not. By the way, panel data always has the problem of heteroscedasticity, so even you use 2sls to estimate equations one by one, then estimators are no longer fully efficient.
In greene's book, even you use 3SLS, you do not have many gains of efficience. But if you want to publish a paper and you have a SEM, you had better use 3SLS or you have to justify why you do not use it.
 [em09]
I don't see anything egregiously wrong with your code - assuming you have specified it correctly. And assuming this is not actually your code, but you have specified N2SLS and N3SLS instead of 2SLS and 3SLS in the PROC MODEL code.
But I don't see why you think you would get the same results from both procs.PROC SYSLIN is designed to work on simultaneous linear equations. It will run OLS methodologies for each of your three methods. Bear in mind that OLS and 2SLS are essentially single-equation methods, and will not take into account any correlations of errors across equations. Depending on your problem and your data, they may still be prefrable to 3SLS.
However, PROC MODEL is designed to work on non-linear equations and sets of non-linear equations. It minimizes an objective function using a specified goal-seeking algorithm. The two do not use the same methodology to solve the problem. So I don't see that they would come up with the same results. Particularly if the data don't fit the models extremely well.
HTH,
David
谢谢!
我有一本格林的英文版,清华大学出版社的,记不请是第几版了,反正买了有
三四年了,看了一遍被别人借走了,当时也没注意这个问题。
SAS原来也会,还拿到过SAS公司资格证书,但自从5、6年前用上EVIEWS,就再没用过SAS,
现在已基本忘光了
 扫码加好友,拉您进群
 全部版块
全部版块 我的主页
我的主页

 收藏
收藏


