公式是这个
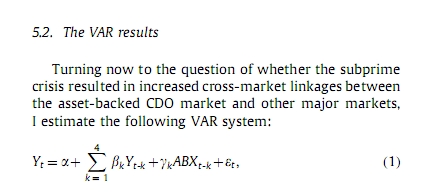
这个是回归结果,我就这里看不懂:This table reports the Newey–West t-statistics for the indicated coefficients from the estimation of the VAR specification shown below, where each VAR is estimated separately for the indicated year. Also reported is the p-value for the F-test of the hypothesis that 伽马r1=r2=r3=r4= 0(就是公式的ABX之前的系数伽马打不出来rk). In this specification, Y denotes the financial market variable that appears as the dependent variable while ABX denotes the ABX。
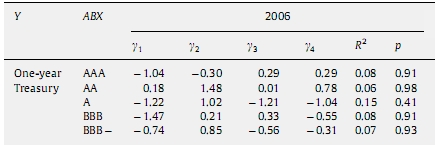
我看不懂黄字部分怎么做出来的啊? 回归结果给出的P-value 是不是就是hypothesis:伽马K全=0做出来的啊,这个检验怎么做的啊,是用的Newey–West t-statistics吗? 这里跳跃太大了 我真心搞不懂,下边是回归分析,里边也有提
![G3]~EE@V44NVKKR7SH(MO$B.jpg](https://m.pinggu.org/bbs/forum.php?mod=image&aid=1559711&size=200x200&key=0e9f20f28c080465&type=fixnone "G3]~EE@V44NVKKR7SH(MO$B.jpg")
|


 扫码加好友,拉您进群
 全部版块
全部版块 我的主页
我的主页

 收藏
收藏
![G3]~EE@V44NVKKR7SH(MO$B.jpg](https://bbs-pic.datacourse.cn/forum/201405/22/145442cnk7clyz9d9u4cks.jpg "G3]~EE@V44NVKKR7SH(MO$B.jpg")
![ME2WUM]}P_G3~)A)WFWE9IL.jpg](https://bbs-pic.datacourse.cn/forum/201405/22/14542333xawfrg4gnpnc7a.jpg "ME2WUM]}P_G3~)A)WFWE9IL.jpg")
SEGV}IE1UM}}NG0H~7.jpg")


