全部版块 我的主页
论坛 计量经济学与统计论坛 五区 计量经济学与统计软件 LATEX论坛
1975 9
2017-02-27

本帖隐藏的内容

What is SVM?


SVM is a supervised machine learning algorithm which can be used for classification or regression problems. It uses a technique called the kernel trick to transform your data and then based on these transformations it finds an optimal boundary between the possible outputs. Simply put, it does some extremely complex data transformations, then figures out how to seperate your data based on the labels or outputs you've defined.

So what makes it so great?


Well SVM it capable of doing both classification and regression. In this post I'll focus on using SVM for classification. In particular I'll be focusing on non-linear SVM, or SVM using a non-linear kernel. Non-linear SVM means that the boundary that the algorithm calculates doesn't have to be a straight line. The benefit is that you can capture much more complex relationships between your datapoints without having to perform difficult transformations on your own. The downside is that the training time is much longer as it's much more computationally intensive.


二维码

扫码加我 拉你入群

请注明:姓名-公司-职位

以便审核进群资格,未注明则拒绝

全部回复
2017-2-27 16:41:52
Cows and Wolves


So what is the kernel trick?

The kernel trick takes the data you give it and transforms it. In goes some great features which you think are going to make a great classifier, and out comes some data that you don't recognize anymore. It is sort of like unraveling a strand of DNA. You start with this harmelss looking vector of data and after putting it through the kernel trick, it's unraveled and compounded itself until it's now a much larger set of data that can't be understood by looking at a spreadsheet. But here lies the magic, in expanding the dataset there are now more obvious boundaries between your classes and the SVM algorithm is able to compute a much more optimal hyperplane.

For a second, pretend you're a farmer and you have a problem--you need to setup a fence to protect your cows from packs of wovles. But where do you build your fence? Well if you're a really data driven farmer one way you could do it would be to build a classifier based on the position of the cows and wolves in your pasture. Racehorsing a few different types of classifiers, we see that SVM does a great job at seperating your cows from the packs of wolves. I thought these plots also do a nice job of illustrating the benefits of using a non-linear classifiers. You can see the the logistic and decision tree models both only make use of straight lines.


二维码

扫码加我 拉你入群

请注明:姓名-公司-职位

以便审核进群资格,未注明则拒绝

2017-2-27 16:43:36
Want to recreate the analysis?


Want to create these plots for yourself? You can run the code in your terminal or in an IDE of your choice, but, big surprise, I'd recommend Rodeo. It has a great pop-out plot feature that comes in handy for this type of analysis. It also ships with Python already included for Windows machines. Besides that, it's now lightning fast thanks to the hard work of TakenPilot.

Once you've downloaded Rodeo, you'll need to save the raw cows_and_wolves.txt file from my github. Make sure you've set your working directory to where you saved the file.


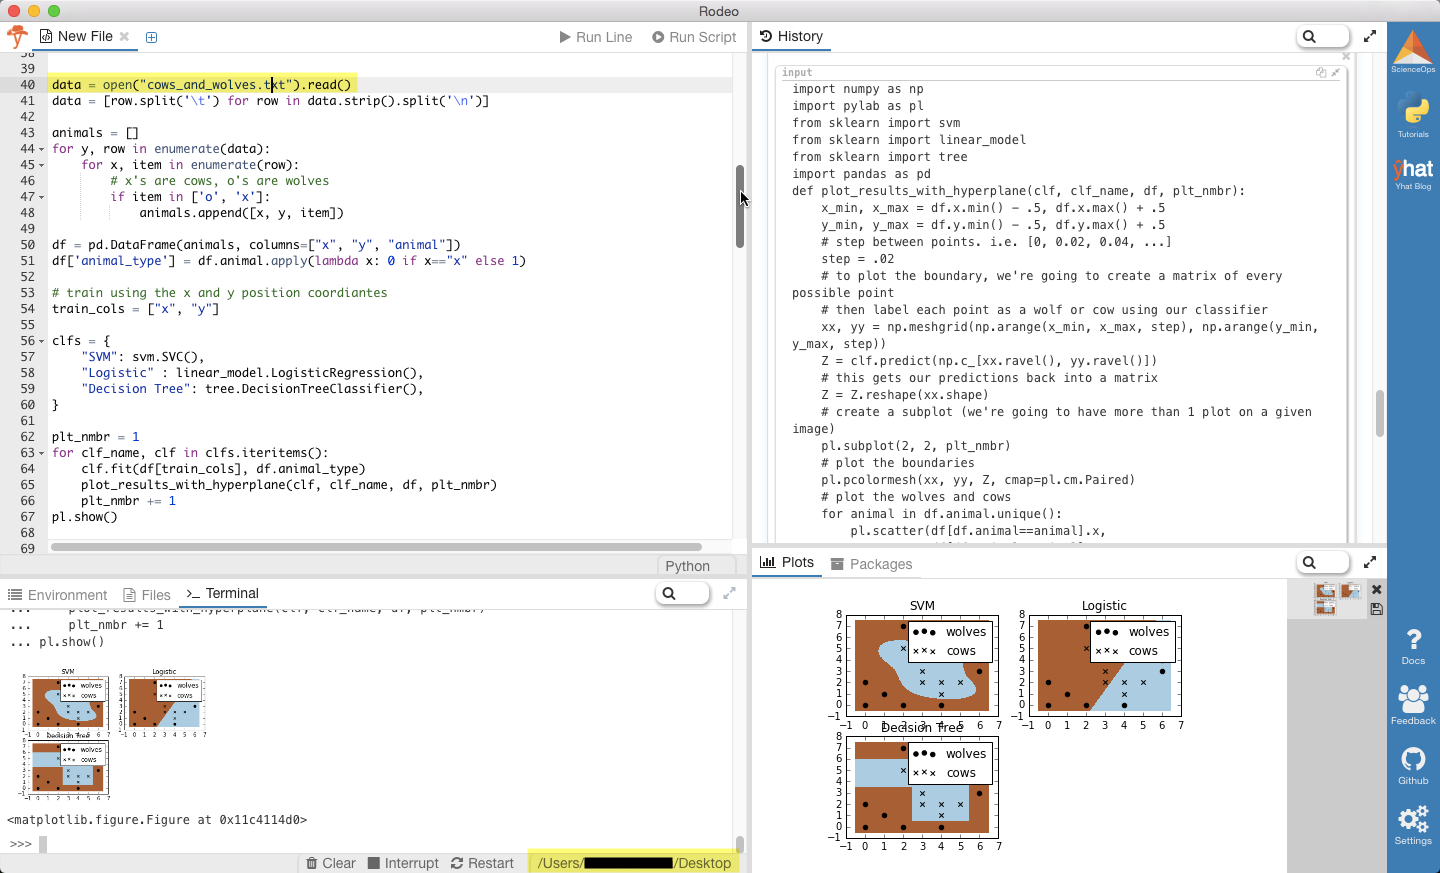
Alright, now just copy and paste the code below into Rodeo, and run it, either by line or the entire script. Don't forget, you can pop out your plots tab, move around your windows, or resize them.


二维码

扫码加我 拉你入群

请注明:姓名-公司-职位

以便审核进群资格,未注明则拒绝

2017-2-27 16:44:41
Machine Learning Refined
二维码

扫码加我 拉你入群

请注明:姓名-公司-职位

以便审核进群资格,未注明则拒绝

2017-2-27 16:44:49
提示: 作者被禁止或删除 内容自动屏蔽
二维码

扫码加我 拉你入群

请注明:姓名-公司-职位

以便审核进群资格,未注明则拒绝

2017-2-27 16:46:22
ding!!!!!!!!!!!!!!!!!!!
二维码

扫码加我 拉你入群

请注明:姓名-公司-职位

以便审核进群资格,未注明则拒绝

点击查看更多内容…
相关推荐
栏目导航
热门文章
推荐文章

说点什么

分享

扫码加好友,拉您进群
各岗位、行业、专业交流群